OK.Wahl
Internetpräsentation
Version 2.2.12
Ergebnis zur Landtagswahl 2018 am 14.10.2018
Stimmkreis Bayreuth - Landkreis Landkreis Bayreuth - Stadt Waischenfeld
Es wurden alle Stimmbezirke ausgewertet.
 Diagramm
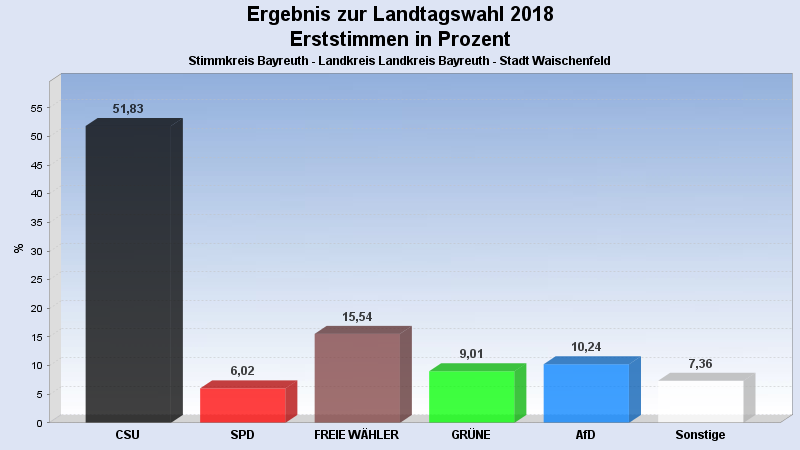
 Seitenanfang
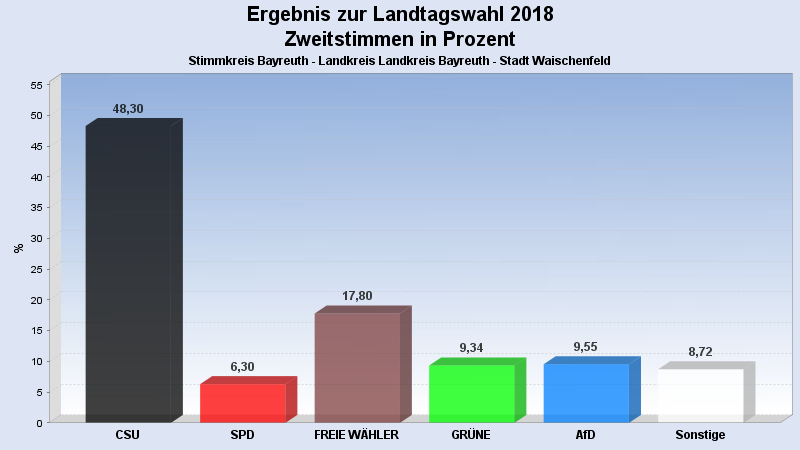
Wahlbeteiligung, Stimmzettel, Stimmen
| Wahlbeteiligung: | 77,23% |
|---|---|
| Stimmberechtigte: | 2.530 |
| Wähler: | 1.954 |
| Ungültige Erststimmen: | 11 |
| Gültige Erststimmen: | 1.943 |
| Ungültige Zweitstimmen: | 16 |
| Gültige Zweitstimmen: | 1.938 |
Erststimmen nach Wahlvorschlag
| Partei | Erststimmen | Prozent | |
|---|---|---|---|
| 1 | Brendel-Fischer, Gudrun (CSU) | 1.007 | 51,83% |
| 2 | Tasdelen, Halil (SPD) | 117 | 6,02% |
| 3 | Wiedemann, Florian (FREIE WÄHLER) | 302 | 15,54% |
| 4 | Pargent, Tim (GRÜNE) | 175 | 9,01% |
| 5 | Funke-Barjak, Luisa (FDP) | 39 | 2,01% |
| 6 | Sommerer, Sebastian (DIE LINKE) | 29 | 1,49% |
| 7 | Ehret, Alfred (BP) | 29 | 1,49% |
| 8 | Koppe, Bernd (ÖDP) | 12 | 0,62% |
| 10 | Rausch, Thomas (AfD) | 199 | 10,24% |
| 11 | Raithel, Christine (mut) | 10 | 0,51% |
| 12 | Kreten, Julian (Die PARTEI) | 17 | 0,87% |
| 14 | Frederking, Reinhard (V-Partei³) | 7 | 0,36% |
Zweitstimmen nach Wahlvorschlag
| Partei | Zweitstimmen | Prozent | |
|---|---|---|---|
| 1 | CSU | 936 | 48,30% |
| 2 | SPD | 122 | 6,30% |
| 3 | FREIE WÄHLER | 345 | 17,80% |
| 4 | GRÜNE | 181 | 9,34% |
| 5 | FDP | 57 | 2,94% |
| 6 | DIE LINKE | 29 | 1,50% |
| 7 | BP | 30 | 1,55% |
| 8 | ÖDP | 16 | 0,83% |
| 9 | PIRATEN | 8 | 0,41% |
| 10 | AfD | 185 | 9,55% |
| 11 | mut | 3 | 0,15% |
| 12 | Die PARTEI | 15 | 0,77% |
| 13 | Gesundheitsforschung | 7 | 0,36% |
| 14 | V-Partei³ | 4 | 0,21% |
- Stand: 22.10.2018 08:57:10