OK.Wahl
Internetpräsentation
Version 2.2.12
Ergebnis zur Landtagswahl 2018 am 14.10.2018
Stimmkreis Bayreuth - Landkreis Landkreis Bayreuth
Es wurden alle Stimmbezirke ausgewertet.
 Diagramm
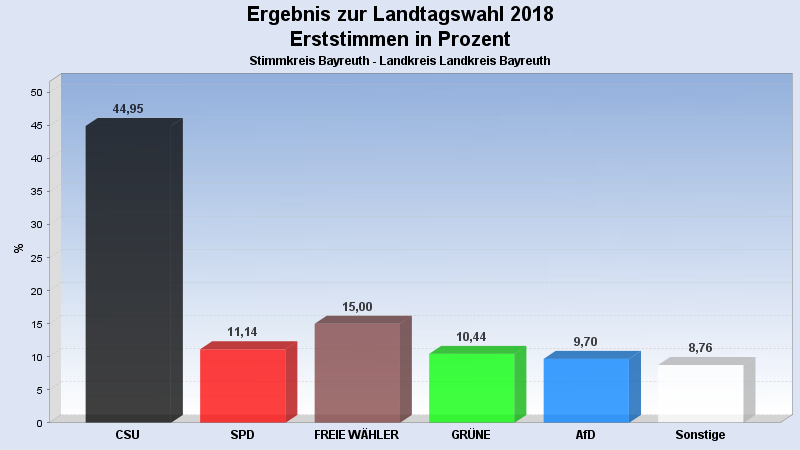
 Seitenanfang
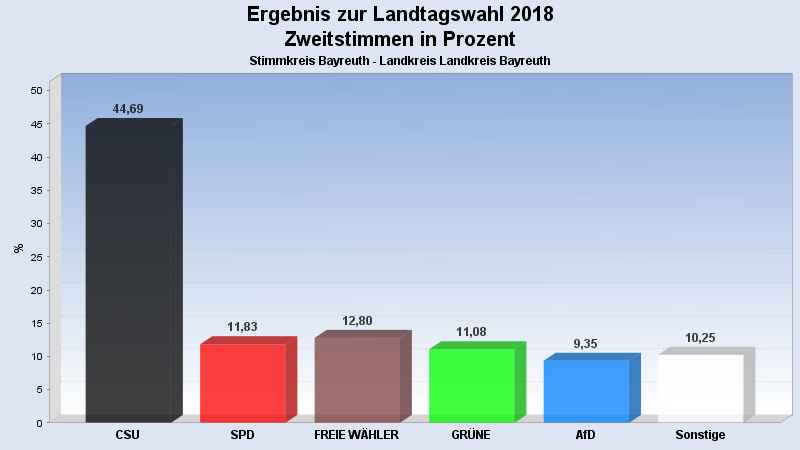
Wahlbeteiligung, Stimmzettel, Stimmen
| Wahlbeteiligung: | 74,76% |
|---|---|
| Stimmberechtigte: | 72.980 |
| Wähler: | 54.558 |
| Ungültige Erststimmen: | 310 |
| Gültige Erststimmen: | 54.248 |
| Ungültige Zweitstimmen: | 567 |
| Gültige Zweitstimmen: | 53.991 |
Erststimmen nach Wahlvorschlag
| Partei | Erststimmen | Prozent | |
|---|---|---|---|
| 1 | Brendel-Fischer, Gudrun (CSU) | 24.383 | 44,95% |
| 2 | Tasdelen, Halil (SPD) | 6.044 | 11,14% |
| 3 | Wiedemann, Florian (FREIE WÄHLER) | 8.138 | 15,00% |
| 4 | Pargent, Tim (GRÜNE) | 5.666 | 10,44% |
| 5 | Funke-Barjak, Luisa (FDP) | 1.590 | 2,93% |
| 6 | Sommerer, Sebastian (DIE LINKE) | 1.128 | 2,08% |
| 7 | Ehret, Alfred (BP) | 503 | 0,93% |
| 8 | Koppe, Bernd (ÖDP) | 379 | 0,70% |
| 10 | Rausch, Thomas (AfD) | 5.264 | 9,70% |
| 11 | Raithel, Christine (mut) | 322 | 0,59% |
| 12 | Kreten, Julian (Die PARTEI) | 511 | 0,94% |
| 14 | Frederking, Reinhard (V-Partei³) | 320 | 0,59% |
Zweitstimmen nach Wahlvorschlag
| Partei | Zweitstimmen | Prozent | |
|---|---|---|---|
| 1 | CSU | 24.126 | 44,69% |
| 2 | SPD | 6.386 | 11,83% |
| 3 | FREIE WÄHLER | 6.913 | 12,80% |
| 4 | GRÜNE | 5.982 | 11,08% |
| 5 | FDP | 2.233 | 4,14% |
| 6 | DIE LINKE | 1.124 | 2,08% |
| 7 | BP | 469 | 0,87% |
| 8 | ÖDP | 341 | 0,63% |
| 9 | PIRATEN | 208 | 0,39% |
| 10 | AfD | 5.050 | 9,35% |
| 11 | mut | 279 | 0,52% |
| 12 | Die PARTEI | 486 | 0,90% |
| 13 | Gesundheitsforschung | 98 | 0,18% |
| 14 | V-Partei³ | 296 | 0,55% |
- Stand: 22.10.2018 08:55:04