OK.Wahl
Internetpräsentation
Version 2.2.12
Ergebnis zur Landtagswahl 2018 am 14.10.2018
Stimmkreis Bayreuth - Landkreis Landkreis Bayreuth - Gemeinde Speichersdorf
Es wurden alle Stimmbezirke ausgewertet.
 Diagramm
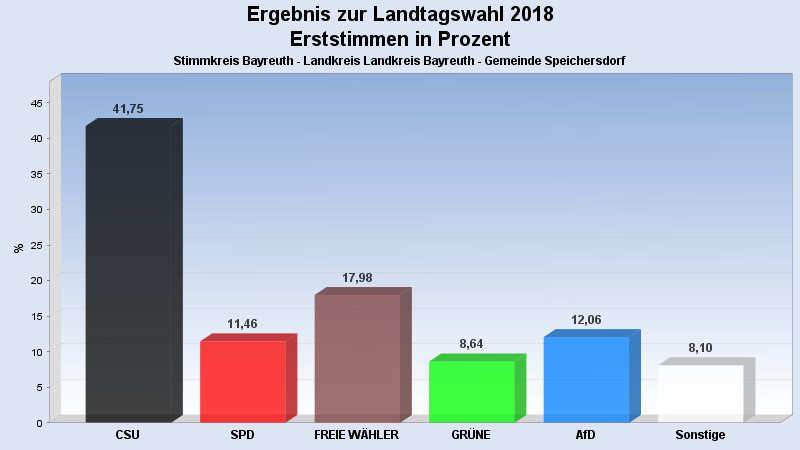
 Seitenanfang
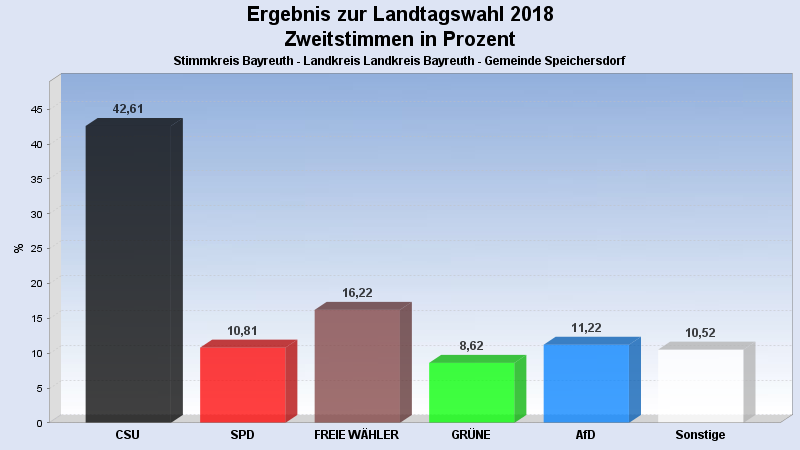
Wahlbeteiligung, Stimmzettel, Stimmen
| Wahlbeteiligung: | 70,24% |
|---|---|
| Stimmberechtigte: | 4.526 |
| Wähler: | 3.179 |
| Ungültige Erststimmen: | 20 |
| Gültige Erststimmen: | 3.159 |
| Ungültige Zweitstimmen: | 34 |
| Gültige Zweitstimmen: | 3.145 |
Erststimmen nach Wahlvorschlag
| Partei | Erststimmen | Prozent | |
|---|---|---|---|
| 1 | Brendel-Fischer, Gudrun (CSU) | 1.319 | 41,75% |
| 2 | Tasdelen, Halil (SPD) | 362 | 11,46% |
| 3 | Wiedemann, Florian (FREIE WÄHLER) | 568 | 17,98% |
| 4 | Pargent, Tim (GRÜNE) | 273 | 8,64% |
| 5 | Funke-Barjak, Luisa (FDP) | 81 | 2,56% |
| 6 | Sommerer, Sebastian (DIE LINKE) | 75 | 2,37% |
| 7 | Ehret, Alfred (BP) | 38 | 1,20% |
| 8 | Koppe, Bernd (ÖDP) | 12 | 0,38% |
| 10 | Rausch, Thomas (AfD) | 381 | 12,06% |
| 11 | Raithel, Christine (mut) | 19 | 0,60% |
| 12 | Kreten, Julian (Die PARTEI) | 25 | 0,79% |
| 14 | Frederking, Reinhard (V-Partei³) | 6 | 0,19% |
Zweitstimmen nach Wahlvorschlag
| Partei | Zweitstimmen | Prozent | |
|---|---|---|---|
| 1 | CSU | 1.340 | 42,61% |
| 2 | SPD | 340 | 10,81% |
| 3 | FREIE WÄHLER | 510 | 16,22% |
| 4 | GRÜNE | 271 | 8,62% |
| 5 | FDP | 121 | 3,85% |
| 6 | DIE LINKE | 79 | 2,51% |
| 7 | BP | 36 | 1,14% |
| 8 | ÖDP | 15 | 0,48% |
| 9 | PIRATEN | 9 | 0,29% |
| 10 | AfD | 353 | 11,22% |
| 11 | mut | 19 | 0,60% |
| 12 | Die PARTEI | 30 | 0,95% |
| 13 | Gesundheitsforschung | 9 | 0,29% |
| 14 | V-Partei³ | 13 | 0,41% |
- Stand: 22.10.2018 08:57:01