OK.Wahl
Internetpräsentation
Version 2.2.12
Ergebnis zur Landtagswahl 2018 am 14.10.2018
Stimmkreis Bayreuth - Landkreis Landkreis Bayreuth - Gemeinde Mistelgau
Es wurden alle Stimmbezirke ausgewertet.
 Diagramm
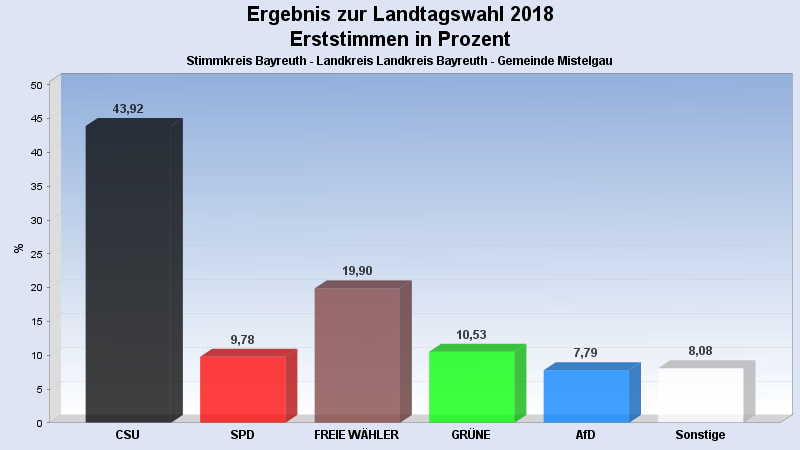
 Seitenanfang
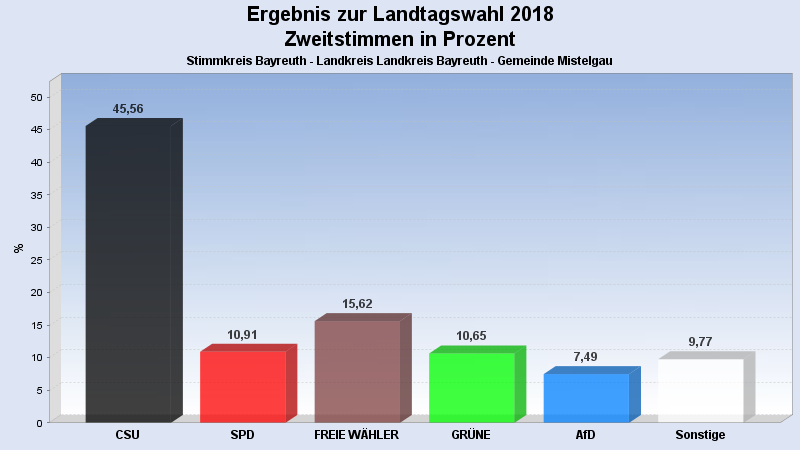
Wahlbeteiligung, Stimmzettel, Stimmen
| Wahlbeteiligung: | 77,66% |
|---|---|
| Stimmberechtigte: | 3.106 |
| Wähler: | 2.412 |
| Ungültige Erststimmen: | 10 |
| Gültige Erststimmen: | 2.402 |
| Ungültige Zweitstimmen: | 37 |
| Gültige Zweitstimmen: | 2.375 |
Erststimmen nach Wahlvorschlag
| Partei | Erststimmen | Prozent | |
|---|---|---|---|
| 1 | Brendel-Fischer, Gudrun (CSU) | 1.055 | 43,92% |
| 2 | Tasdelen, Halil (SPD) | 235 | 9,78% |
| 3 | Wiedemann, Florian (FREIE WÄHLER) | 478 | 19,90% |
| 4 | Pargent, Tim (GRÜNE) | 253 | 10,53% |
| 5 | Funke-Barjak, Luisa (FDP) | 82 | 3,41% |
| 6 | Sommerer, Sebastian (DIE LINKE) | 35 | 1,46% |
| 7 | Ehret, Alfred (BP) | 13 | 0,54% |
| 8 | Koppe, Bernd (ÖDP) | 28 | 1,17% |
| 10 | Rausch, Thomas (AfD) | 187 | 7,79% |
| 11 | Raithel, Christine (mut) | 9 | 0,37% |
| 12 | Kreten, Julian (Die PARTEI) | 14 | 0,58% |
| 14 | Frederking, Reinhard (V-Partei³) | 13 | 0,54% |
Zweitstimmen nach Wahlvorschlag
| Partei | Zweitstimmen | Prozent | |
|---|---|---|---|
| 1 | CSU | 1.082 | 45,56% |
| 2 | SPD | 259 | 10,91% |
| 3 | FREIE WÄHLER | 371 | 15,62% |
| 4 | GRÜNE | 253 | 10,65% |
| 5 | FDP | 110 | 4,63% |
| 6 | DIE LINKE | 33 | 1,39% |
| 7 | BP | 14 | 0,59% |
| 8 | ÖDP | 16 | 0,67% |
| 9 | PIRATEN | 5 | 0,21% |
| 10 | AfD | 178 | 7,49% |
| 11 | mut | 17 | 0,72% |
| 12 | Die PARTEI | 22 | 0,93% |
| 13 | Gesundheitsforschung | 2 | 0,08% |
| 14 | V-Partei³ | 13 | 0,55% |
- Stand: 22.10.2018 08:56:20