OK.Wahl
Internetpräsentation
Version 2.2.12
Ergebnis zur Landtagswahl 2018 am 14.10.2018
Stimmkreis Bayreuth - Landkreis Landkreis Bayreuth - Gemeinde Glashütten
Es wurden alle Stimmbezirke ausgewertet.
 Diagramm
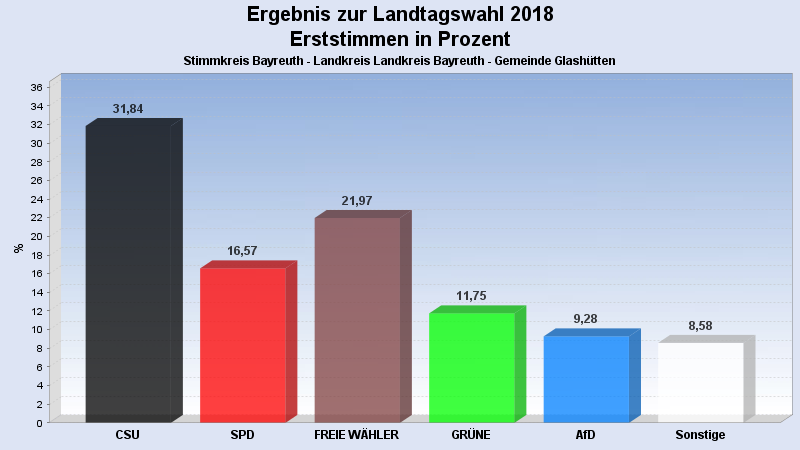
 Seitenanfang
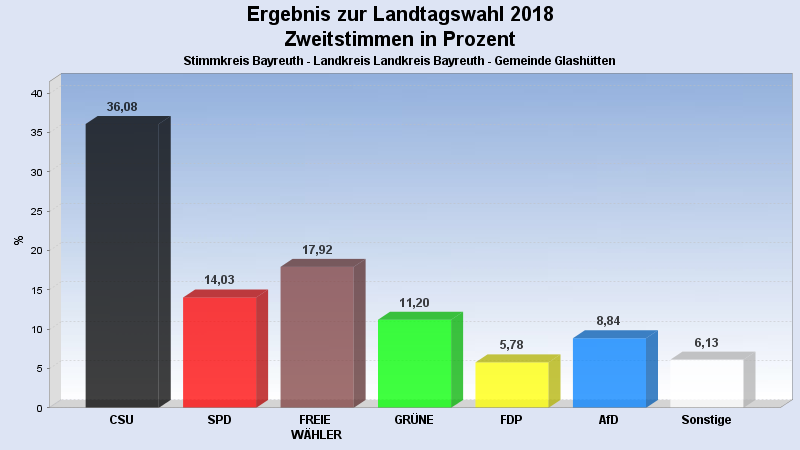
Wahlbeteiligung, Stimmzettel, Stimmen
| Wahlbeteiligung: | 72,89% |
|---|---|
| Stimmberechtigte: | 1.173 |
| Wähler: | 855 |
| Ungültige Erststimmen: | 4 |
| Gültige Erststimmen: | 851 |
| Ungültige Zweitstimmen: | 7 |
| Gültige Zweitstimmen: | 848 |
Erststimmen nach Wahlvorschlag
| Partei | Erststimmen | Prozent | |
|---|---|---|---|
| 1 | Brendel-Fischer, Gudrun (CSU) | 271 | 31,84% |
| 2 | Tasdelen, Halil (SPD) | 141 | 16,57% |
| 3 | Wiedemann, Florian (FREIE WÄHLER) | 187 | 21,97% |
| 4 | Pargent, Tim (GRÜNE) | 100 | 11,75% |
| 5 | Funke-Barjak, Luisa (FDP) | 33 | 3,88% |
| 6 | Sommerer, Sebastian (DIE LINKE) | 22 | 2,59% |
| 7 | Ehret, Alfred (BP) | 1 | 0,12% |
| 8 | Koppe, Bernd (ÖDP) | 8 | 0,94% |
| 10 | Rausch, Thomas (AfD) | 79 | 9,28% |
| 11 | Raithel, Christine (mut) | 0 | 0,00% |
| 12 | Kreten, Julian (Die PARTEI) | 6 | 0,71% |
| 14 | Frederking, Reinhard (V-Partei³) | 3 | 0,35% |
Zweitstimmen nach Wahlvorschlag
| Partei | Zweitstimmen | Prozent | |
|---|---|---|---|
| 1 | CSU | 306 | 36,08% |
| 2 | SPD | 119 | 14,03% |
| 3 | FREIE WÄHLER | 152 | 17,92% |
| 4 | GRÜNE | 95 | 11,20% |
| 5 | FDP | 49 | 5,78% |
| 6 | DIE LINKE | 27 | 3,18% |
| 7 | BP | 5 | 0,59% |
| 8 | ÖDP | 3 | 0,35% |
| 9 | PIRATEN | 6 | 0,71% |
| 10 | AfD | 75 | 8,84% |
| 11 | mut | 0 | 0,00% |
| 12 | Die PARTEI | 9 | 1,06% |
| 13 | Gesundheitsforschung | 0 | 0,00% |
| 14 | V-Partei³ | 2 | 0,24% |
- Stand: 22.10.2018 08:55:49