OK.Wahl
Internetpräsentation
Version 2.2.12
Ergebnis zur Landtagswahl 2018 am 14.10.2018
Stimmkreis Bayreuth - Landkreis Landkreis Bayreuth - Gemeinde Aufseß
Es wurden alle Stimmbezirke ausgewertet.
 Diagramm
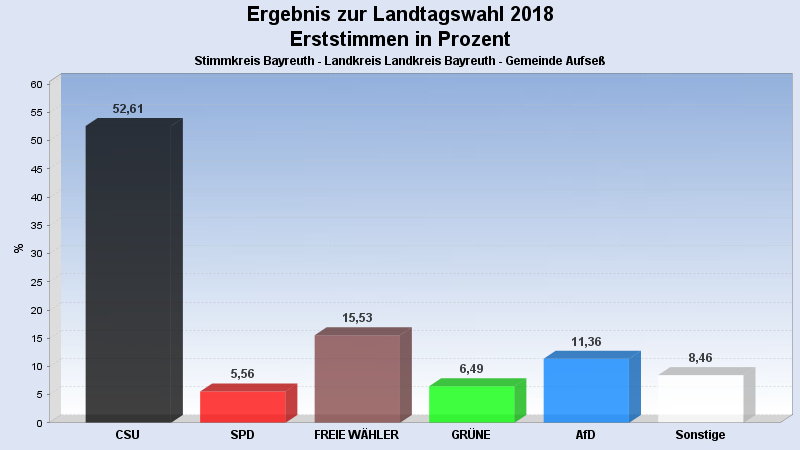
 Seitenanfang
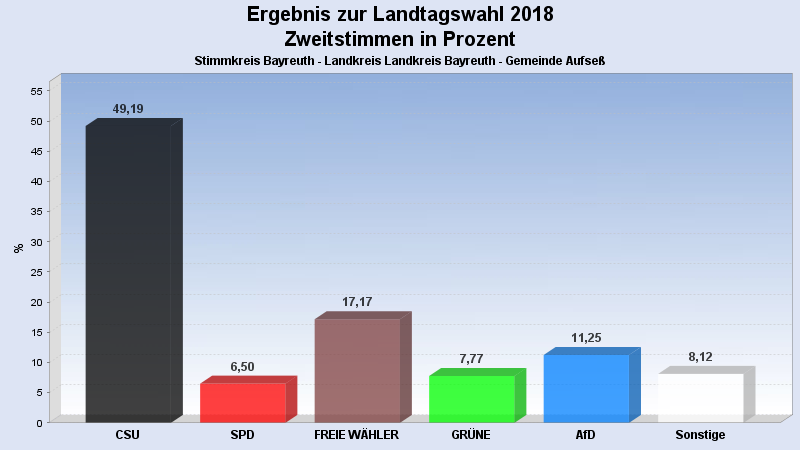
Wahlbeteiligung, Stimmzettel, Stimmen
| Wahlbeteiligung: | 80,63% |
|---|---|
| Stimmberechtigte: | 1.079 |
| Wähler: | 870 |
| Ungültige Erststimmen: | 7 |
| Gültige Erststimmen: | 863 |
| Ungültige Zweitstimmen: | 8 |
| Gültige Zweitstimmen: | 862 |
Erststimmen nach Wahlvorschlag
| Partei | Erststimmen | Prozent | |
|---|---|---|---|
| 1 | Brendel-Fischer, Gudrun (CSU) | 454 | 52,61% |
| 2 | Tasdelen, Halil (SPD) | 48 | 5,56% |
| 3 | Wiedemann, Florian (FREIE WÄHLER) | 134 | 15,53% |
| 4 | Pargent, Tim (GRÜNE) | 56 | 6,49% |
| 5 | Funke-Barjak, Luisa (FDP) | 19 | 2,20% |
| 6 | Sommerer, Sebastian (DIE LINKE) | 13 | 1,51% |
| 7 | Ehret, Alfred (BP) | 11 | 1,27% |
| 8 | Koppe, Bernd (ÖDP) | 12 | 1,39% |
| 10 | Rausch, Thomas (AfD) | 98 | 11,36% |
| 11 | Raithel, Christine (mut) | 5 | 0,58% |
| 12 | Kreten, Julian (Die PARTEI) | 12 | 1,39% |
| 14 | Frederking, Reinhard (V-Partei³) | 1 | 0,12% |
Zweitstimmen nach Wahlvorschlag
| Partei | Zweitstimmen | Prozent | |
|---|---|---|---|
| 1 | CSU | 424 | 49,19% |
| 2 | SPD | 56 | 6,50% |
| 3 | FREIE WÄHLER | 148 | 17,17% |
| 4 | GRÜNE | 67 | 7,77% |
| 5 | FDP | 16 | 1,86% |
| 6 | DIE LINKE | 9 | 1,04% |
| 7 | BP | 13 | 1,51% |
| 8 | ÖDP | 9 | 1,04% |
| 9 | PIRATEN | 6 | 0,70% |
| 10 | AfD | 97 | 11,25% |
| 11 | mut | 4 | 0,46% |
| 12 | Die PARTEI | 12 | 1,39% |
| 13 | Gesundheitsforschung | 1 | 0,12% |
| 14 | V-Partei³ | 0 | 0,00% |
- Stand: 22.10.2018 08:55:11