OK.Wahl
Internetpräsentation
Version 2.2.7
Ergebnis zur Bezirkswahl 2013 am 15.09.2013
Stimmkreis Bayreuth - Landkreis Landkreis Bayreuth - Gemeinde Speichersdorf
Es wurden alle Stimmbezirke ausgewertet.
 Diagramm
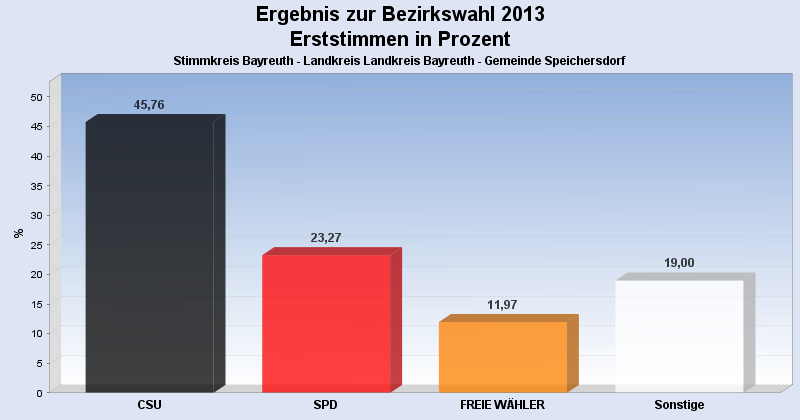
 Seitenanfang
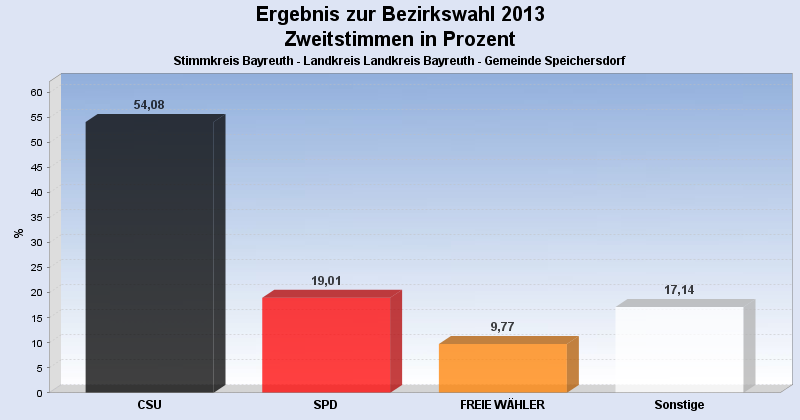
Wahlbeteiligung, Stimmzettel, Stimmen
| Wahlbeteiligung: | 62,63% |
|---|---|
| Stimmberechtigte: | 4.587 |
| Wähler: | 2.873 |
| Ungültige Erststimmen: | 41 |
| Gültige Erststimmen: | 2.832 |
| Ungültige Zweitstimmen: | 79 |
| Gültige Zweitstimmen: | 2.794 |
Erststimmen nach Wahlvorschlag
| Partei | Erststimmen | Prozent | |
|---|---|---|---|
| 1 | Dr. Specht, Stefan ( CSU ) | 1.296 | 45,76% |
| 2 | Dr. Kuhn, Beate ( SPD ) | 659 | 23,27% |
| 3 | Frühbeißer, Stefan ( FREIE WÄHLER ) | 339 | 11,97% |
| 4 | Pargent, Tim ( GRÜNE ) | 113 | 3,99% |
| 5 | Dr. Schweingel, Dieter ( FDP ) | 121 | 4,27% |
| 6 | Böhner, Georg ( DIE LINKE ) | 48 | 1,69% |
| 7 | Zimmermann, Konrad ( ÖDP ) | 14 | 0,49% |
| 8 | Prechtl, Hermann ( REP ) | 16 | 0,56% |
| 9 | Blankenburg, Moroni ( NPD ) | 35 | 1,24% |
| 10 | Schneider, Jürgen ( BP ) | 24 | 0,85% |
| 12 | Dressendörfer, Horst ( DIE FRANKEN ) | 76 | 2,68% |
| 13 | Gudat, Max ( PIRATEN ) | 91 | 3,21% |
Zweitstimmen nach Wahlvorschlag
| Partei | Zweitstimmen | Prozent | |
|---|---|---|---|
| 1 | CSU | 1.511 | 54,08% |
| 2 | SPD | 531 | 19,01% |
| 3 | FREIE WÄHLER | 273 | 9,77% |
| 4 | GRÜNE | 127 | 4,55% |
| 5 | FDP | 82 | 2,93% |
| 6 | DIE LINKE | 41 | 1,47% |
| 7 | ÖDP | 12 | 0,43% |
| 8 | REP | 23 | 0,82% |
| 9 | NPD | 32 | 1,15% |
| 10 | BP | 21 | 0,75% |
| 11 | FRAUENLISTE | 23 | 0,82% |
| 12 | DIE FRANKEN | 43 | 1,54% |
| 13 | PIRATEN | 75 | 2,68% |
- Stand: 22.09.2013 16:55:24