OK.Wahl
Internetpräsentation
Version 2.2.7
Ergebnis zur Bezirkswahl 2013 am 15.09.2013
Stimmkreis Bayreuth - Landkreis Landkreis Bayreuth
Es wurden alle Stimmbezirke ausgewertet.
 Diagramm
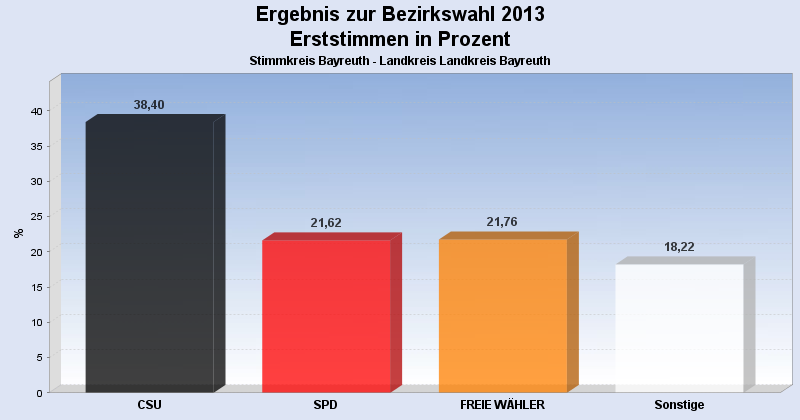
 Seitenanfang
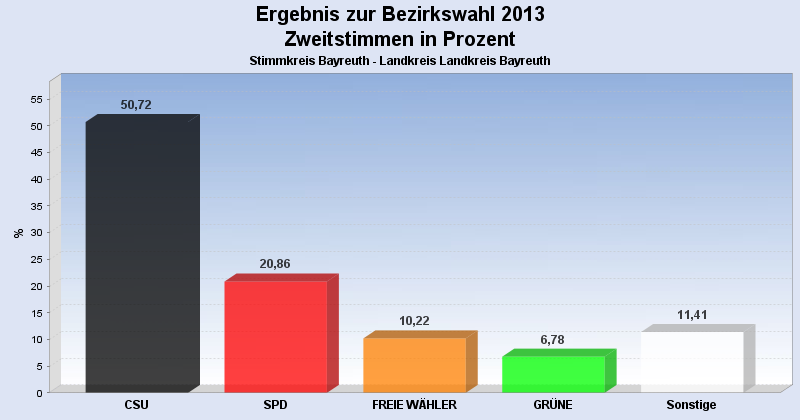
Wahlbeteiligung, Stimmzettel, Stimmen
| Wahlbeteiligung: | 66,77% |
|---|---|
| Stimmberechtigte: | 73.604 |
| Wähler: | 49.146 |
| Ungültige Erststimmen: | 528 |
| Gültige Erststimmen: | 48.589 |
| Ungültige Zweitstimmen: | 988 |
| Gültige Zweitstimmen: | 48.155 |
Erststimmen nach Wahlvorschlag
| Partei | Erststimmen | Prozent | |
|---|---|---|---|
| 1 | Dr. Specht, Stefan ( CSU ) | 18.659 | 38,40% |
| 2 | Dr. Kuhn, Beate ( SPD ) | 10.505 | 21,62% |
| 3 | Frühbeißer, Stefan ( FREIE WÄHLER ) | 10.571 | 21,76% |
| 4 | Pargent, Tim ( GRÜNE ) | 2.392 | 4,92% |
| 5 | Dr. Schweingel, Dieter ( FDP ) | 1.398 | 2,88% |
| 6 | Böhner, Georg ( DIE LINKE ) | 739 | 1,52% |
| 7 | Zimmermann, Konrad ( ÖDP ) | 402 | 0,83% |
| 8 | Prechtl, Hermann ( REP ) | 482 | 0,99% |
| 9 | Blankenburg, Moroni ( NPD ) | 469 | 0,97% |
| 10 | Schneider, Jürgen ( BP ) | 282 | 0,58% |
| 12 | Dressendörfer, Horst ( DIE FRANKEN ) | 1.872 | 3,85% |
| 13 | Gudat, Max ( PIRATEN ) | 818 | 1,68% |
Zweitstimmen nach Wahlvorschlag
| Partei | Zweitstimmen | Prozent | |
|---|---|---|---|
| 1 | CSU | 24.425 | 50,72% |
| 2 | SPD | 10.047 | 20,86% |
| 3 | FREIE WÄHLER | 4.921 | 10,22% |
| 4 | GRÜNE | 3.266 | 6,78% |
| 5 | FDP | 962 | 2,00% |
| 6 | DIE LINKE | 730 | 1,52% |
| 7 | ÖDP | 337 | 0,70% |
| 8 | REP | 528 | 1,10% |
| 9 | NPD | 487 | 1,01% |
| 10 | BP | 405 | 0,84% |
| 11 | FRAUENLISTE | 265 | 0,55% |
| 12 | DIE FRANKEN | 1.071 | 2,22% |
| 13 | PIRATEN | 711 | 1,48% |
- Stand: 22.09.2013 16:54:16