OK.Wahl
Internetpräsentation
Version 2.2.7
Ergebnis zur Bezirkswahl 2013 am 15.09.2013
Stimmkreis Bayreuth - Landkreis Landkreis Bayreuth - Markt Schnabelwaid
Es wurden alle Stimmbezirke ausgewertet.
 Diagramm
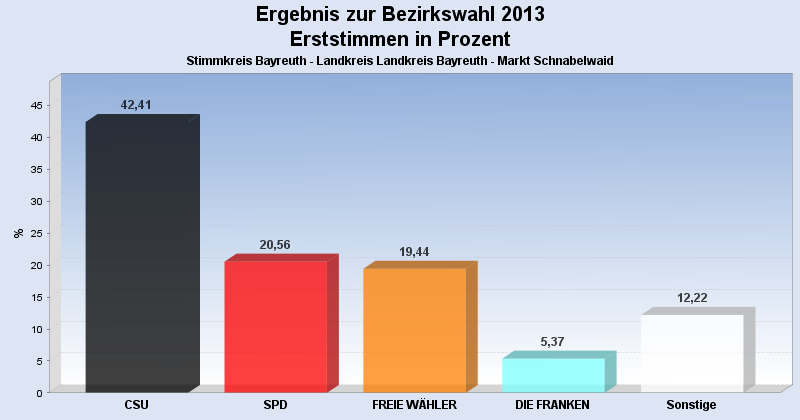
 Seitenanfang
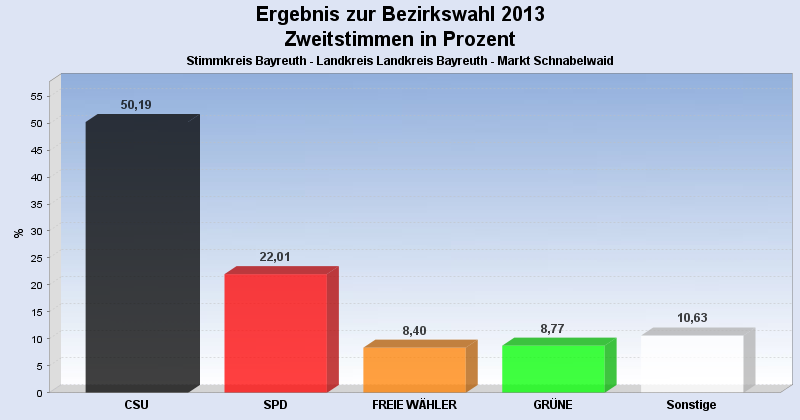
Wahlbeteiligung, Stimmzettel, Stimmen
| Wahlbeteiligung: | 67,70% |
|---|---|
| Stimmberechtigte: | 805 |
| Wähler: | 545 |
| Ungültige Erststimmen: | 5 |
| Gültige Erststimmen: | 540 |
| Ungültige Zweitstimmen: | 9 |
| Gültige Zweitstimmen: | 536 |
Erststimmen nach Wahlvorschlag
| Partei | Erststimmen | Prozent | |
|---|---|---|---|
| 1 | Dr. Specht, Stefan ( CSU ) | 229 | 42,41% |
| 2 | Dr. Kuhn, Beate ( SPD ) | 111 | 20,56% |
| 3 | Frühbeißer, Stefan ( FREIE WÄHLER ) | 105 | 19,44% |
| 4 | Pargent, Tim ( GRÜNE ) | 25 | 4,63% |
| 5 | Dr. Schweingel, Dieter ( FDP ) | 8 | 1,48% |
| 6 | Böhner, Georg ( DIE LINKE ) | 8 | 1,48% |
| 7 | Zimmermann, Konrad ( ÖDP ) | 4 | 0,74% |
| 8 | Prechtl, Hermann ( REP ) | 3 | 0,56% |
| 9 | Blankenburg, Moroni ( NPD ) | 8 | 1,48% |
| 10 | Schneider, Jürgen ( BP ) | 4 | 0,74% |
| 12 | Dressendörfer, Horst ( DIE FRANKEN ) | 29 | 5,37% |
| 13 | Gudat, Max ( PIRATEN ) | 6 | 1,11% |
Zweitstimmen nach Wahlvorschlag
| Partei | Zweitstimmen | Prozent | |
|---|---|---|---|
| 1 | CSU | 269 | 50,19% |
| 2 | SPD | 118 | 22,01% |
| 3 | FREIE WÄHLER | 45 | 8,40% |
| 4 | GRÜNE | 47 | 8,77% |
| 5 | FDP | 7 | 1,31% |
| 6 | DIE LINKE | 9 | 1,68% |
| 7 | ÖDP | 4 | 0,75% |
| 8 | REP | 3 | 0,56% |
| 9 | NPD | 8 | 1,49% |
| 10 | BP | 8 | 1,49% |
| 11 | FRAUENLISTE | 3 | 0,56% |
| 12 | DIE FRANKEN | 11 | 2,05% |
| 13 | PIRATEN | 4 | 0,75% |
- Stand: 22.09.2013 16:55:21