OK.Wahl
Internetpräsentation
Version 2.2.7
Ergebnis zur Bezirkswahl 2013 am 15.09.2013
Stimmkreis Bayreuth - Landkreis Landkreis Bayreuth - Stadt Pegnitz - Stimmbezirk Nemschenreuth (0020)
Stimmbezirk ausgewertet.
 Diagramm
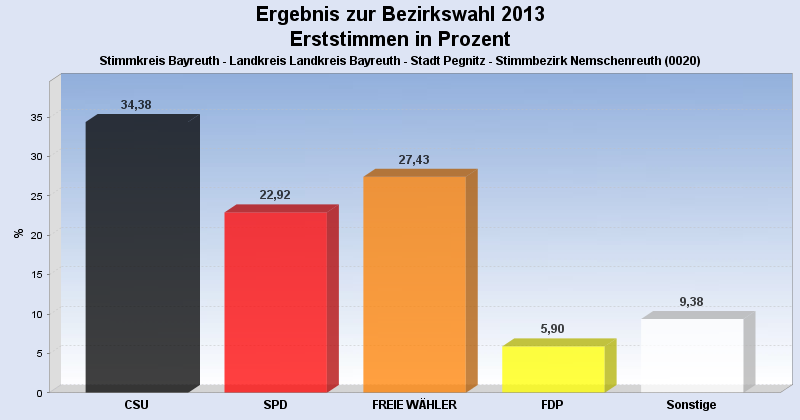
 Seitenanfang
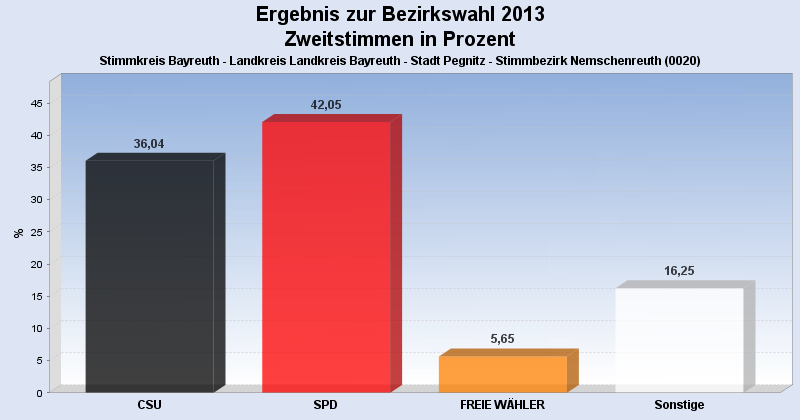
Wahlbeteiligung, Stimmzettel, Stimmen
| Stimmberechtigte: | 561 |
|---|---|
| Wähler: | 293 |
| Ungültige Erststimmen: | 5 |
| Gültige Erststimmen: | 288 |
| Ungültige Zweitstimmen: | 10 |
| Gültige Zweitstimmen: | 283 |
Erststimmen nach Wahlvorschlag
| Partei | Erststimmen | Prozent | |
|---|---|---|---|
| 1 | Dr. Specht, Stefan ( CSU ) | 99 | 34,38% |
| 2 | Dr. Kuhn, Beate ( SPD ) | 66 | 22,92% |
| 3 | Frühbeißer, Stefan ( FREIE WÄHLER ) | 79 | 27,43% |
| 4 | Pargent, Tim ( GRÜNE ) | 0 | 0,00% |
| 5 | Dr. Schweingel, Dieter ( FDP ) | 17 | 5,90% |
| 6 | Böhner, Georg ( DIE LINKE ) | 1 | 0,35% |
| 7 | Zimmermann, Konrad ( ÖDP ) | 0 | 0,00% |
| 8 | Prechtl, Hermann ( REP ) | 10 | 3,47% |
| 9 | Blankenburg, Moroni ( NPD ) | 0 | 0,00% |
| 10 | Schneider, Jürgen ( BP ) | 0 | 0,00% |
| 12 | Dressendörfer, Horst ( DIE FRANKEN ) | 5 | 1,74% |
| 13 | Gudat, Max ( PIRATEN ) | 11 | 3,82% |
Zweitstimmen nach Wahlvorschlag
| Partei | Zweitstimmen | Prozent | |
|---|---|---|---|
| 1 | CSU | 102 | 36,04% |
| 2 | SPD | 119 | 42,05% |
| 3 | FREIE WÄHLER | 16 | 5,65% |
| 4 | GRÜNE | 14 | 4,95% |
| 5 | FDP | 7 | 2,47% |
| 6 | DIE LINKE | 1 | 0,35% |
| 7 | ÖDP | 1 | 0,35% |
| 8 | REP | 4 | 1,41% |
| 9 | NPD | 0 | 0,00% |
| 10 | BP | 4 | 1,41% |
| 11 | FRAUENLISTE | 0 | 0,00% |
| 12 | DIE FRANKEN | 6 | 2,12% |
| 13 | PIRATEN | 9 | 3,18% |
- Stand: 22.09.2013 16:55:10