OK.Wahl
Internetpräsentation
Version 2.2.7
Ergebnis zur Bezirkswahl 2013 am 15.09.2013
Stimmkreis Bayreuth - Landkreis Landkreis Bayreuth - Stadt Pegnitz
Es wurden alle Stimmbezirke ausgewertet.
 Diagramm
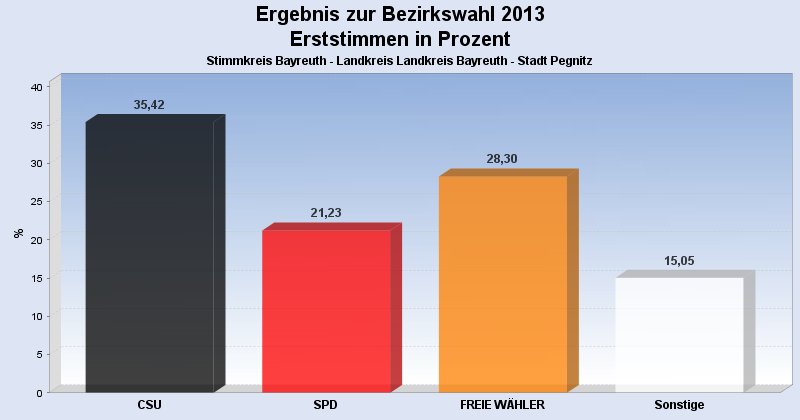
 Seitenanfang
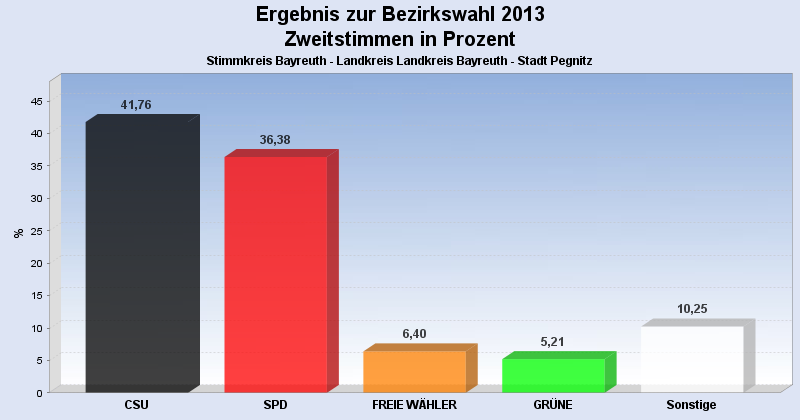
Wahlbeteiligung, Stimmzettel, Stimmen
| Wahlbeteiligung: | 65,87% |
|---|---|
| Stimmberechtigte: | 10.948 |
| Wähler: | 7.211 |
| Ungültige Erststimmen: | 62 |
| Gültige Erststimmen: | 7.149 |
| Ungültige Zweitstimmen: | 135 |
| Gültige Zweitstimmen: | 7.076 |
Erststimmen nach Wahlvorschlag
| Partei | Erststimmen | Prozent | |
|---|---|---|---|
| 1 | Dr. Specht, Stefan ( CSU ) | 2.532 | 35,42% |
| 2 | Dr. Kuhn, Beate ( SPD ) | 1.518 | 21,23% |
| 3 | Frühbeißer, Stefan ( FREIE WÄHLER ) | 2.023 | 28,30% |
| 4 | Pargent, Tim ( GRÜNE ) | 302 | 4,22% |
| 5 | Dr. Schweingel, Dieter ( FDP ) | 143 | 2,00% |
| 6 | Böhner, Georg ( DIE LINKE ) | 117 | 1,64% |
| 7 | Zimmermann, Konrad ( ÖDP ) | 29 | 0,41% |
| 8 | Prechtl, Hermann ( REP ) | 112 | 1,57% |
| 9 | Blankenburg, Moroni ( NPD ) | 58 | 0,81% |
| 10 | Schneider, Jürgen ( BP ) | 63 | 0,88% |
| 12 | Dressendörfer, Horst ( DIE FRANKEN ) | 162 | 2,27% |
| 13 | Gudat, Max ( PIRATEN ) | 90 | 1,26% |
Zweitstimmen nach Wahlvorschlag
| Partei | Zweitstimmen | Prozent | |
|---|---|---|---|
| 1 | CSU | 2.955 | 41,76% |
| 2 | SPD | 2.574 | 36,38% |
| 3 | FREIE WÄHLER | 453 | 6,40% |
| 4 | GRÜNE | 369 | 5,21% |
| 5 | FDP | 110 | 1,55% |
| 6 | DIE LINKE | 97 | 1,37% |
| 7 | ÖDP | 29 | 0,41% |
| 8 | REP | 67 | 0,95% |
| 9 | NPD | 68 | 0,96% |
| 10 | BP | 120 | 1,70% |
| 11 | FRAUENLISTE | 34 | 0,48% |
| 12 | DIE FRANKEN | 111 | 1,57% |
| 13 | PIRATEN | 89 | 1,26% |
- Stand: 22.09.2013 16:55:02