OK.Wahl
Internetpräsentation
Version 2.2.12
Ergebnis zur Landtagswahl 2018 am 14.10.2018
Stimmkreis Bayreuth - Landkreis Landkreis Bayreuth - Gemeinde Warmensteinach
Es wurden alle Stimmbezirke ausgewertet.
 Diagramm
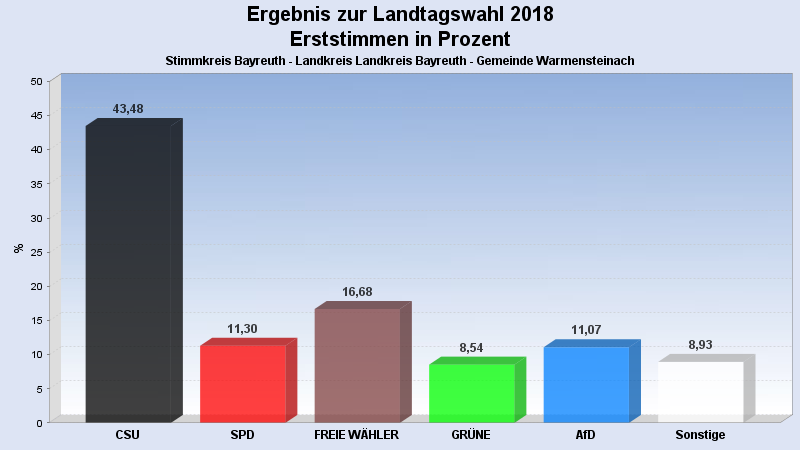
 Seitenanfang
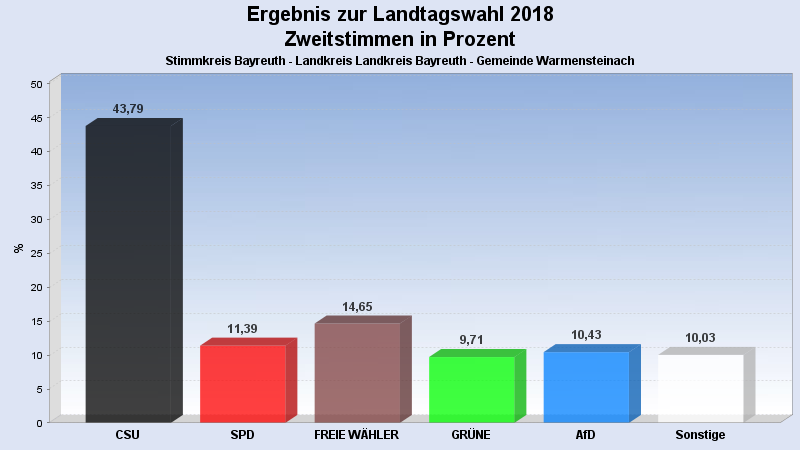
Wahlbeteiligung, Stimmzettel, Stimmen
| Wahlbeteiligung: | 71,85% |
|---|---|
| Stimmberechtigte: | 1.769 |
| Wähler: | 1.271 |
| Ungültige Erststimmen: | 6 |
| Gültige Erststimmen: | 1.265 |
| Ungültige Zweitstimmen: | 15 |
| Gültige Zweitstimmen: | 1.256 |
Erststimmen nach Wahlvorschlag
| Partei | Erststimmen | Prozent | |
|---|---|---|---|
| 1 | Brendel-Fischer, Gudrun (CSU) | 550 | 43,48% |
| 2 | Tasdelen, Halil (SPD) | 143 | 11,30% |
| 3 | Wiedemann, Florian (FREIE WÄHLER) | 211 | 16,68% |
| 4 | Pargent, Tim (GRÜNE) | 108 | 8,54% |
| 5 | Funke-Barjak, Luisa (FDP) | 33 | 2,61% |
| 6 | Sommerer, Sebastian (DIE LINKE) | 34 | 2,69% |
| 7 | Ehret, Alfred (BP) | 18 | 1,42% |
| 8 | Koppe, Bernd (ÖDP) | 6 | 0,47% |
| 10 | Rausch, Thomas (AfD) | 140 | 11,07% |
| 11 | Raithel, Christine (mut) | 5 | 0,40% |
| 12 | Kreten, Julian (Die PARTEI) | 10 | 0,79% |
| 14 | Frederking, Reinhard (V-Partei³) | 7 | 0,55% |
Zweitstimmen nach Wahlvorschlag
| Partei | Zweitstimmen | Prozent | |
|---|---|---|---|
| 1 | CSU | 550 | 43,79% |
| 2 | SPD | 143 | 11,39% |
| 3 | FREIE WÄHLER | 184 | 14,65% |
| 4 | GRÜNE | 122 | 9,71% |
| 5 | FDP | 44 | 3,50% |
| 6 | DIE LINKE | 29 | 2,31% |
| 7 | BP | 16 | 1,27% |
| 8 | ÖDP | 4 | 0,32% |
| 9 | PIRATEN | 7 | 0,56% |
| 10 | AfD | 131 | 10,43% |
| 11 | mut | 6 | 0,48% |
| 12 | Die PARTEI | 10 | 0,80% |
| 13 | Gesundheitsforschung | 3 | 0,24% |
| 14 | V-Partei³ | 7 | 0,56% |
- Stand: 22.10.2018 08:57:14