OK.Wahl
Internetpräsentation
Version 2.2.12
Ergebnis zur Landtagswahl 2018 am 14.10.2018
Stimmkreis Bayreuth - Landkreis Landkreis Bayreuth - Gemeinde Seybothenreuth
Es wurden alle Stimmbezirke ausgewertet.
 Diagramm
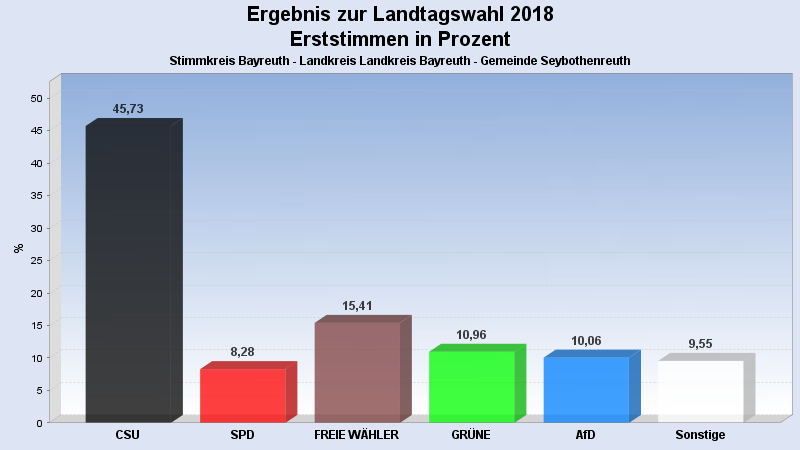
 Seitenanfang
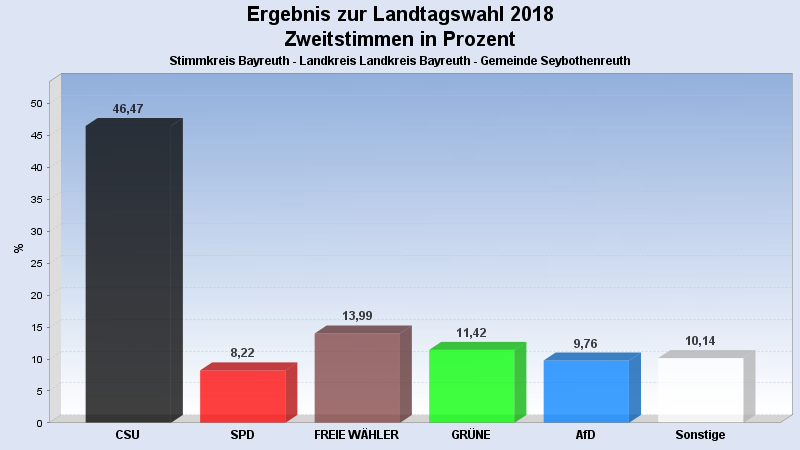
Wahlbeteiligung, Stimmzettel, Stimmen
| Wahlbeteiligung: | 77,68% |
|---|---|
| Stimmberechtigte: | 1.017 |
| Wähler: | 790 |
| Ungültige Erststimmen: | 5 |
| Gültige Erststimmen: | 785 |
| Ungültige Zweitstimmen: | 11 |
| Gültige Zweitstimmen: | 779 |
Erststimmen nach Wahlvorschlag
| Partei | Erststimmen | Prozent | |
|---|---|---|---|
| 1 | Brendel-Fischer, Gudrun (CSU) | 359 | 45,73% |
| 2 | Tasdelen, Halil (SPD) | 65 | 8,28% |
| 3 | Wiedemann, Florian (FREIE WÄHLER) | 121 | 15,41% |
| 4 | Pargent, Tim (GRÜNE) | 86 | 10,96% |
| 5 | Funke-Barjak, Luisa (FDP) | 24 | 3,06% |
| 6 | Sommerer, Sebastian (DIE LINKE) | 24 | 3,06% |
| 7 | Ehret, Alfred (BP) | 4 | 0,51% |
| 8 | Koppe, Bernd (ÖDP) | 5 | 0,64% |
| 10 | Rausch, Thomas (AfD) | 79 | 10,06% |
| 11 | Raithel, Christine (mut) | 6 | 0,76% |
| 12 | Kreten, Julian (Die PARTEI) | 4 | 0,51% |
| 14 | Frederking, Reinhard (V-Partei³) | 8 | 1,02% |
Zweitstimmen nach Wahlvorschlag
| Partei | Zweitstimmen | Prozent | |
|---|---|---|---|
| 1 | CSU | 362 | 46,47% |
| 2 | SPD | 64 | 8,22% |
| 3 | FREIE WÄHLER | 109 | 13,99% |
| 4 | GRÜNE | 89 | 11,42% |
| 5 | FDP | 34 | 4,36% |
| 6 | DIE LINKE | 15 | 1,93% |
| 7 | BP | 3 | 0,39% |
| 8 | ÖDP | 4 | 0,51% |
| 9 | PIRATEN | 0 | 0,00% |
| 10 | AfD | 76 | 9,76% |
| 11 | mut | 7 | 0,90% |
| 12 | Die PARTEI | 9 | 1,16% |
| 13 | Gesundheitsforschung | 2 | 0,26% |
| 14 | V-Partei³ | 5 | 0,64% |
- Stand: 22.10.2018 08:56:58