OK.Wahl
Internetpräsentation
Version 2.2.12
Ergebnis zur Landtagswahl 2018 am 14.10.2018
Stimmkreis Bayreuth - Landkreis Landkreis Bayreuth - Stadt Pottenstein
Es wurden alle Stimmbezirke ausgewertet.
 Diagramm
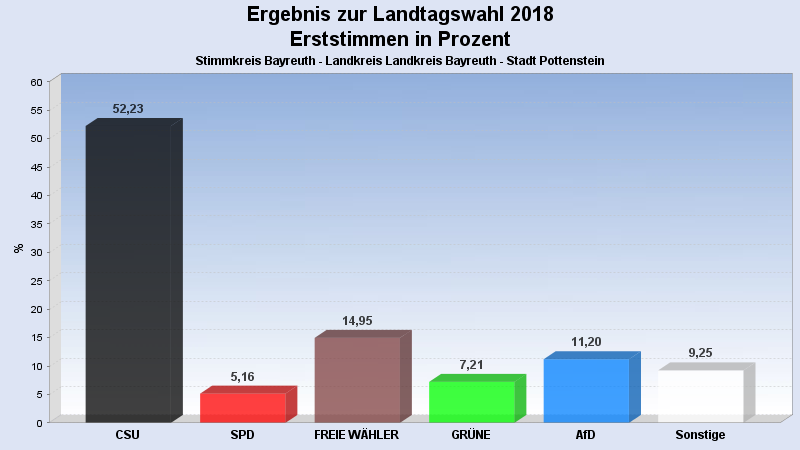
 Seitenanfang
Wahlbeteiligung, Stimmzettel, Stimmen
| Wahlbeteiligung: | 73,69% |
|---|---|
| Stimmberechtigte: | 4.344 |
| Wähler: | 3.201 |
| Ungültige Erststimmen: | 23 |
| Gültige Erststimmen: | 3.178 |
| Ungültige Zweitstimmen: | 39 |
| Gültige Zweitstimmen: | 3.162 |
Erststimmen nach Wahlvorschlag
| Partei | Erststimmen | Prozent | |
|---|---|---|---|
| 1 | Brendel-Fischer, Gudrun (CSU) | 1.660 | 52,23% |
| 2 | Tasdelen, Halil (SPD) | 164 | 5,16% |
| 3 | Wiedemann, Florian (FREIE WÄHLER) | 475 | 14,95% |
| 4 | Pargent, Tim (GRÜNE) | 229 | 7,21% |
| 5 | Funke-Barjak, Luisa (FDP) | 66 | 2,08% |
| 6 | Sommerer, Sebastian (DIE LINKE) | 55 | 1,73% |
| 7 | Ehret, Alfred (BP) | 47 | 1,48% |
| 8 | Koppe, Bernd (ÖDP) | 17 | 0,53% |
| 10 | Rausch, Thomas (AfD) | 356 | 11,20% |
| 11 | Raithel, Christine (mut) | 24 | 0,76% |
| 12 | Kreten, Julian (Die PARTEI) | 57 | 1,79% |
| 14 | Frederking, Reinhard (V-Partei³) | 28 | 0,88% |
Zweitstimmen nach Wahlvorschlag
| Partei | Zweitstimmen | Prozent | |
|---|---|---|---|
| 1 | CSU | 1.629 | 51,52% |
| 2 | SPD | 198 | 6,26% |
| 3 | FREIE WÄHLER | 475 | 15,02% |
| 4 | GRÜNE | 226 | 7,15% |
| 5 | FDP | 109 | 3,45% |
| 6 | DIE LINKE | 59 | 1,87% |
| 7 | BP | 32 | 1,01% |
| 8 | ÖDP | 14 | 0,44% |
| 9 | PIRATEN | 12 | 0,38% |
| 10 | AfD | 339 | 10,72% |
| 11 | mut | 14 | 0,44% |
| 12 | Die PARTEI | 28 | 0,89% |
| 13 | Gesundheitsforschung | 12 | 0,38% |
| 14 | V-Partei³ | 15 | 0,47% |
- Stand: 22.10.2018 08:56:47