OK.Wahl
Internetpräsentation
Version 2.2.12
Ergebnis zur Landtagswahl 2018 am 14.10.2018
Stimmkreis Bayreuth - Landkreis Landkreis Bayreuth - Markt Plech
Es wurden alle Stimmbezirke ausgewertet.
 Diagramm
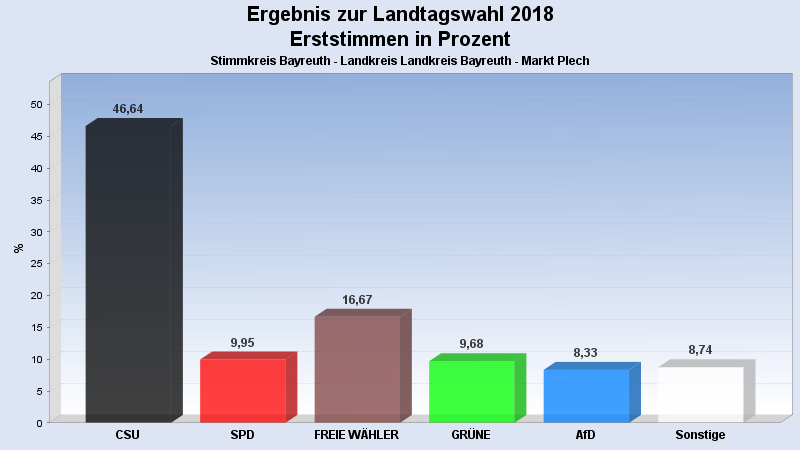
 Seitenanfang
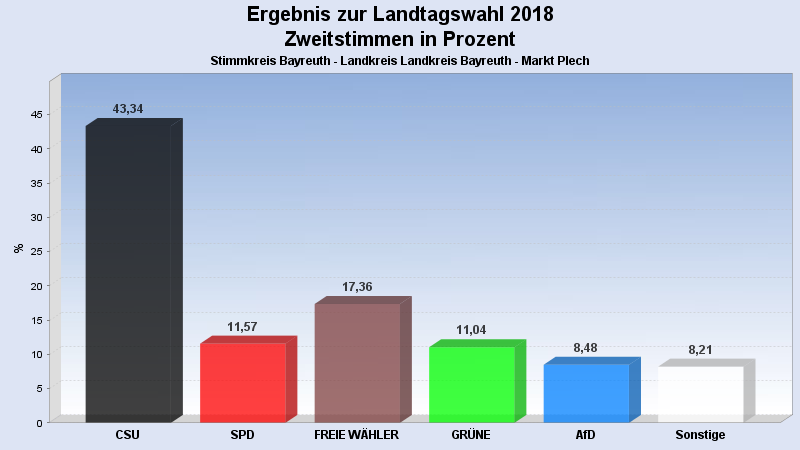
Wahlbeteiligung, Stimmzettel, Stimmen
| Wahlbeteiligung: | 73,28% |
|---|---|
| Stimmberechtigte: | 1.018 |
| Wähler: | 746 |
| Ungültige Erststimmen: | 2 |
| Gültige Erststimmen: | 744 |
| Ungültige Zweitstimmen: | 3 |
| Gültige Zweitstimmen: | 743 |
Erststimmen nach Wahlvorschlag
| Partei | Erststimmen | Prozent | |
|---|---|---|---|
| 1 | Brendel-Fischer, Gudrun (CSU) | 347 | 46,64% |
| 2 | Tasdelen, Halil (SPD) | 74 | 9,95% |
| 3 | Wiedemann, Florian (FREIE WÄHLER) | 124 | 16,67% |
| 4 | Pargent, Tim (GRÜNE) | 72 | 9,68% |
| 5 | Funke-Barjak, Luisa (FDP) | 22 | 2,96% |
| 6 | Sommerer, Sebastian (DIE LINKE) | 13 | 1,75% |
| 7 | Ehret, Alfred (BP) | 10 | 1,34% |
| 8 | Koppe, Bernd (ÖDP) | 5 | 0,67% |
| 10 | Rausch, Thomas (AfD) | 62 | 8,33% |
| 11 | Raithel, Christine (mut) | 4 | 0,54% |
| 12 | Kreten, Julian (Die PARTEI) | 9 | 1,21% |
| 14 | Frederking, Reinhard (V-Partei³) | 2 | 0,27% |
Zweitstimmen nach Wahlvorschlag
| Partei | Zweitstimmen | Prozent | |
|---|---|---|---|
| 1 | CSU | 322 | 43,34% |
| 2 | SPD | 86 | 11,57% |
| 3 | FREIE WÄHLER | 129 | 17,36% |
| 4 | GRÜNE | 82 | 11,04% |
| 5 | FDP | 24 | 3,23% |
| 6 | DIE LINKE | 12 | 1,62% |
| 7 | BP | 8 | 1,08% |
| 8 | ÖDP | 6 | 0,81% |
| 9 | PIRATEN | 0 | 0,00% |
| 10 | AfD | 63 | 8,48% |
| 11 | mut | 1 | 0,13% |
| 12 | Die PARTEI | 8 | 1,08% |
| 13 | Gesundheitsforschung | 0 | 0,00% |
| 14 | V-Partei³ | 2 | 0,27% |
- Stand: 22.10.2018 08:56:45