OK.Wahl
Internetpräsentation
Version 2.2.12
Ergebnis zur Landtagswahl 2018 am 14.10.2018
Stimmkreis Bayreuth - Landkreis Landkreis Bayreuth - Stadt Pegnitz
Es wurden alle Stimmbezirke ausgewertet.
 Diagramm
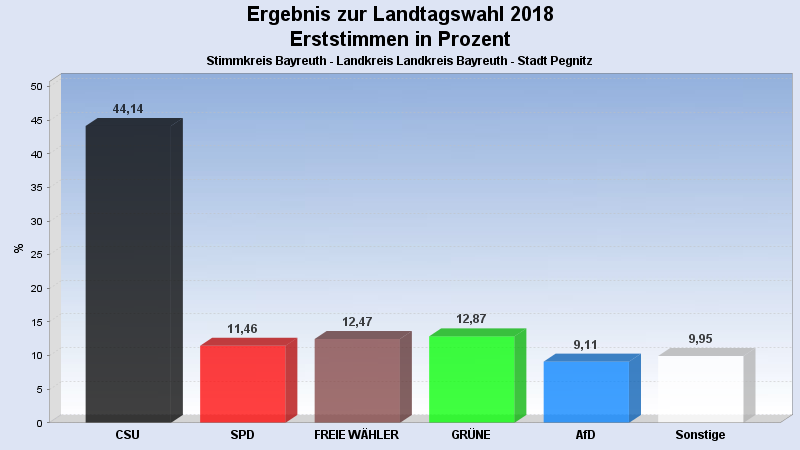
 Seitenanfang
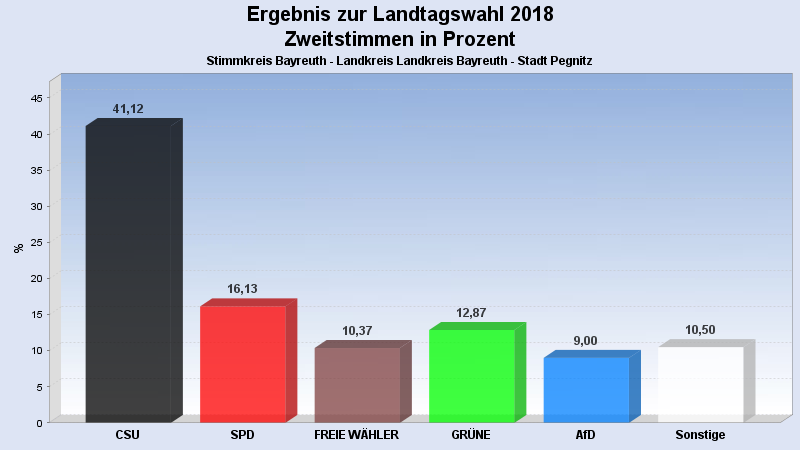
Wahlbeteiligung, Stimmzettel, Stimmen
| Wahlbeteiligung: | 72,17% |
|---|---|
| Stimmberechtigte: | 10.704 |
| Wähler: | 7.725 |
| Ungültige Erststimmen: | 49 |
| Gültige Erststimmen: | 7.676 |
| Ungültige Zweitstimmen: | 80 |
| Gültige Zweitstimmen: | 7.645 |
Erststimmen nach Wahlvorschlag
| Partei | Erststimmen | Prozent | |
|---|---|---|---|
| 1 | Brendel-Fischer, Gudrun (CSU) | 3.388 | 44,14% |
| 2 | Tasdelen, Halil (SPD) | 880 | 11,46% |
| 3 | Wiedemann, Florian (FREIE WÄHLER) | 957 | 12,47% |
| 4 | Pargent, Tim (GRÜNE) | 988 | 12,87% |
| 5 | Funke-Barjak, Luisa (FDP) | 231 | 3,01% |
| 6 | Sommerer, Sebastian (DIE LINKE) | 196 | 2,55% |
| 7 | Ehret, Alfred (BP) | 73 | 0,95% |
| 8 | Koppe, Bernd (ÖDP) | 41 | 0,53% |
| 10 | Rausch, Thomas (AfD) | 699 | 9,11% |
| 11 | Raithel, Christine (mut) | 39 | 0,51% |
| 12 | Kreten, Julian (Die PARTEI) | 73 | 0,95% |
| 14 | Frederking, Reinhard (V-Partei³) | 111 | 1,45% |
Zweitstimmen nach Wahlvorschlag
| Partei | Zweitstimmen | Prozent | |
|---|---|---|---|
| 1 | CSU | 3.144 | 41,12% |
| 2 | SPD | 1.233 | 16,13% |
| 3 | FREIE WÄHLER | 793 | 10,37% |
| 4 | GRÜNE | 984 | 12,87% |
| 5 | FDP | 290 | 3,79% |
| 6 | DIE LINKE | 195 | 2,55% |
| 7 | BP | 67 | 0,88% |
| 8 | ÖDP | 29 | 0,38% |
| 9 | PIRATEN | 34 | 0,44% |
| 10 | AfD | 688 | 9,00% |
| 11 | mut | 38 | 0,50% |
| 12 | Die PARTEI | 57 | 0,75% |
| 13 | Gesundheitsforschung | 10 | 0,13% |
| 14 | V-Partei³ | 83 | 1,09% |
- Stand: 22.10.2018 08:56:27