OK.Wahl
Internetpräsentation
Version 2.2.12
Ergebnis zur Landtagswahl 2018 am 14.10.2018
Stimmkreis Bayreuth - Landkreis Landkreis Bayreuth - Gemeinde Mistelbach
Es wurden alle Stimmbezirke ausgewertet.
 Diagramm
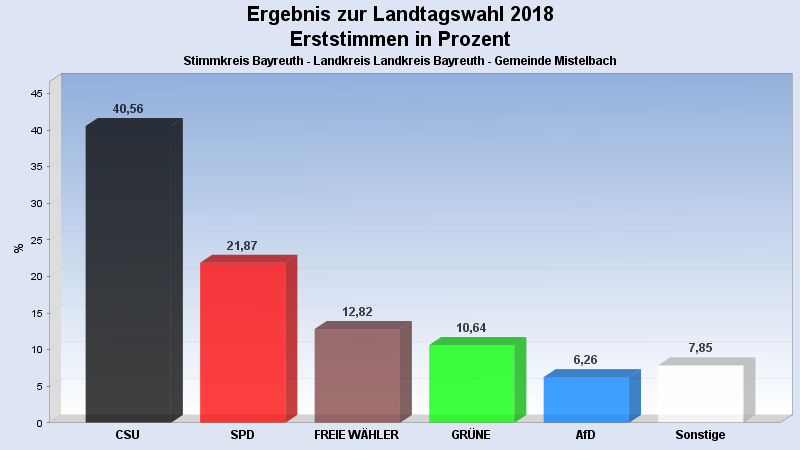
 Seitenanfang
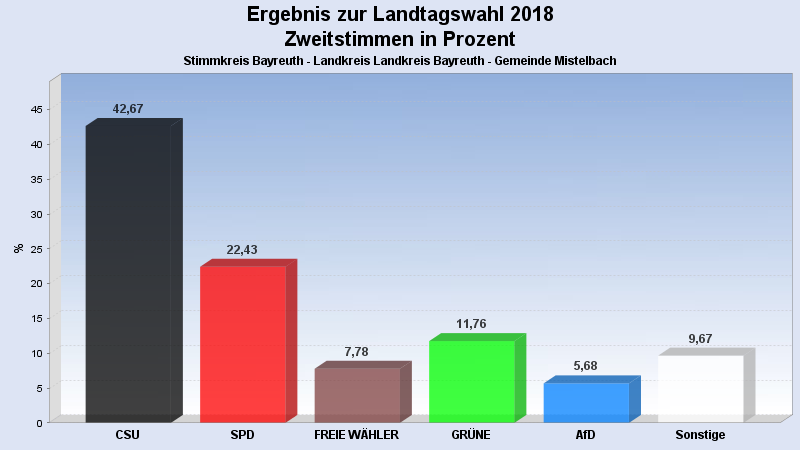
Wahlbeteiligung, Stimmzettel, Stimmen
| Wahlbeteiligung: | 78,83% |
|---|---|
| Stimmberechtigte: | 1.285 |
| Wähler: | 1.013 |
| Ungültige Erststimmen: | 7 |
| Gültige Erststimmen: | 1.006 |
| Ungültige Zweitstimmen: | 10 |
| Gültige Zweitstimmen: | 1.003 |
Erststimmen nach Wahlvorschlag
| Partei | Erststimmen | Prozent | |
|---|---|---|---|
| 1 | Brendel-Fischer, Gudrun (CSU) | 408 | 40,56% |
| 2 | Tasdelen, Halil (SPD) | 220 | 21,87% |
| 3 | Wiedemann, Florian (FREIE WÄHLER) | 129 | 12,82% |
| 4 | Pargent, Tim (GRÜNE) | 107 | 10,64% |
| 5 | Funke-Barjak, Luisa (FDP) | 27 | 2,68% |
| 6 | Sommerer, Sebastian (DIE LINKE) | 15 | 1,49% |
| 7 | Ehret, Alfred (BP) | 4 | 0,40% |
| 8 | Koppe, Bernd (ÖDP) | 18 | 1,79% |
| 10 | Rausch, Thomas (AfD) | 63 | 6,26% |
| 11 | Raithel, Christine (mut) | 4 | 0,40% |
| 12 | Kreten, Julian (Die PARTEI) | 8 | 0,80% |
| 14 | Frederking, Reinhard (V-Partei³) | 3 | 0,30% |
Zweitstimmen nach Wahlvorschlag
| Partei | Zweitstimmen | Prozent | |
|---|---|---|---|
| 1 | CSU | 428 | 42,67% |
| 2 | SPD | 225 | 22,43% |
| 3 | FREIE WÄHLER | 78 | 7,78% |
| 4 | GRÜNE | 118 | 11,76% |
| 5 | FDP | 48 | 4,79% |
| 6 | DIE LINKE | 16 | 1,60% |
| 7 | BP | 5 | 0,50% |
| 8 | ÖDP | 9 | 0,90% |
| 9 | PIRATEN | 1 | 0,10% |
| 10 | AfD | 57 | 5,68% |
| 11 | mut | 7 | 0,70% |
| 12 | Die PARTEI | 6 | 0,60% |
| 13 | Gesundheitsforschung | 1 | 0,10% |
| 14 | V-Partei³ | 4 | 0,40% |
- Stand: 22.10.2018 08:56:17