OK.Wahl
Internetpräsentation
Version 2.2.12
Ergebnis zur Landtagswahl 2018 am 14.10.2018
Stimmkreis Bayreuth - Landkreis Landkreis Bayreuth - Gemeinde Kirchenpingarten
Es wurden alle Stimmbezirke ausgewertet.
 Diagramm
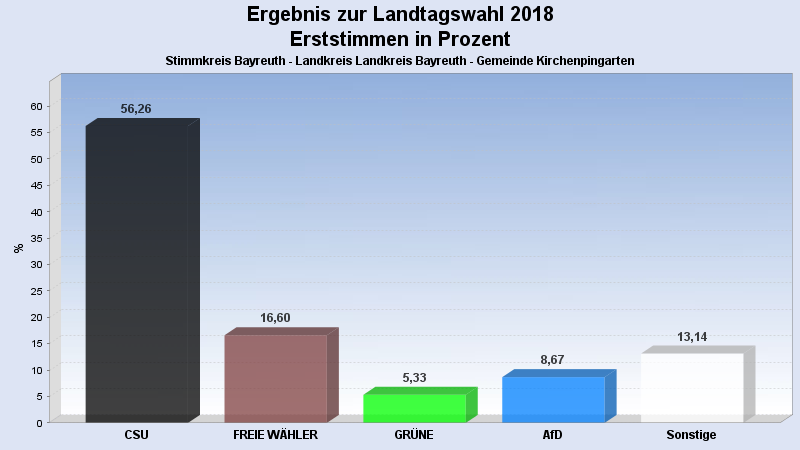
 Seitenanfang
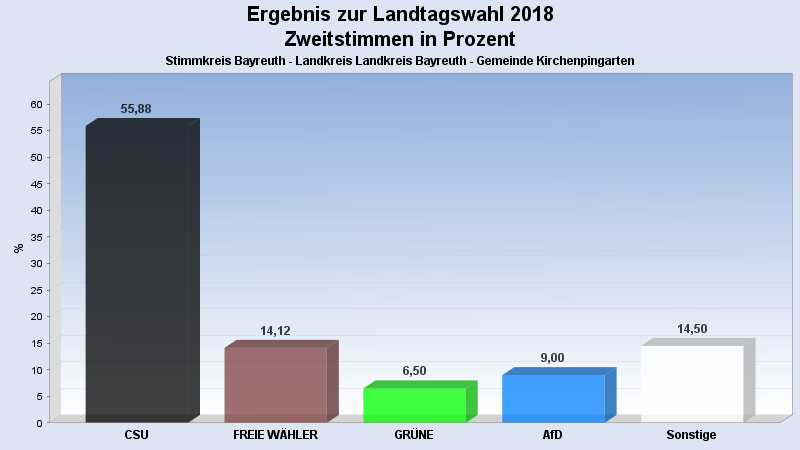
Wahlbeteiligung, Stimmzettel, Stimmen
| Wahlbeteiligung: | 80,86% |
|---|---|
| Stimmberechtigte: | 1.003 |
| Wähler: | 811 |
| Ungültige Erststimmen: | 4 |
| Gültige Erststimmen: | 807 |
| Ungültige Zweitstimmen: | 11 |
| Gültige Zweitstimmen: | 800 |
Erststimmen nach Wahlvorschlag
| Partei | Erststimmen | Prozent | |
|---|---|---|---|
| 1 | Brendel-Fischer, Gudrun (CSU) | 454 | 56,26% |
| 2 | Tasdelen, Halil (SPD) | 37 | 4,58% |
| 3 | Wiedemann, Florian (FREIE WÄHLER) | 134 | 16,60% |
| 4 | Pargent, Tim (GRÜNE) | 43 | 5,33% |
| 5 | Funke-Barjak, Luisa (FDP) | 18 | 2,23% |
| 6 | Sommerer, Sebastian (DIE LINKE) | 10 | 1,24% |
| 7 | Ehret, Alfred (BP) | 16 | 1,98% |
| 8 | Koppe, Bernd (ÖDP) | 7 | 0,87% |
| 10 | Rausch, Thomas (AfD) | 70 | 8,67% |
| 11 | Raithel, Christine (mut) | 6 | 0,74% |
| 12 | Kreten, Julian (Die PARTEI) | 10 | 1,24% |
| 14 | Frederking, Reinhard (V-Partei³) | 2 | 0,25% |
Zweitstimmen nach Wahlvorschlag
| Partei | Zweitstimmen | Prozent | |
|---|---|---|---|
| 1 | CSU | 447 | 55,88% |
| 2 | SPD | 33 | 4,12% |
| 3 | FREIE WÄHLER | 113 | 14,12% |
| 4 | GRÜNE | 52 | 6,50% |
| 5 | FDP | 32 | 4,00% |
| 6 | DIE LINKE | 13 | 1,62% |
| 7 | BP | 15 | 1,88% |
| 8 | ÖDP | 2 | 0,25% |
| 9 | PIRATEN | 2 | 0,25% |
| 10 | AfD | 72 | 9,00% |
| 11 | mut | 5 | 0,62% |
| 12 | Die PARTEI | 10 | 1,25% |
| 13 | Gesundheitsforschung | 1 | 0,12% |
| 14 | V-Partei³ | 3 | 0,38% |
- Stand: 22.10.2018 08:56:15