OK.Wahl
Internetpräsentation
Version 2.2.12
Ergebnis zur Landtagswahl 2018 am 14.10.2018
Stimmkreis Bayreuth - Landkreis Landkreis Bayreuth - Gemeinde Hummeltal
Es wurden alle Stimmbezirke ausgewertet.
 Diagramm
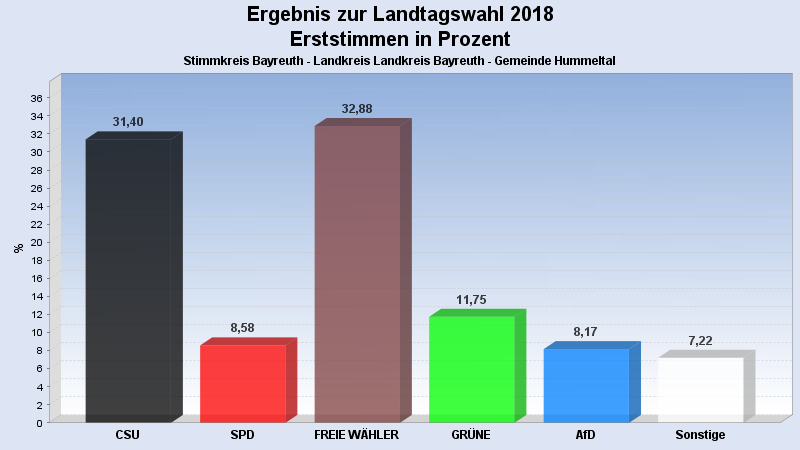
 Seitenanfang
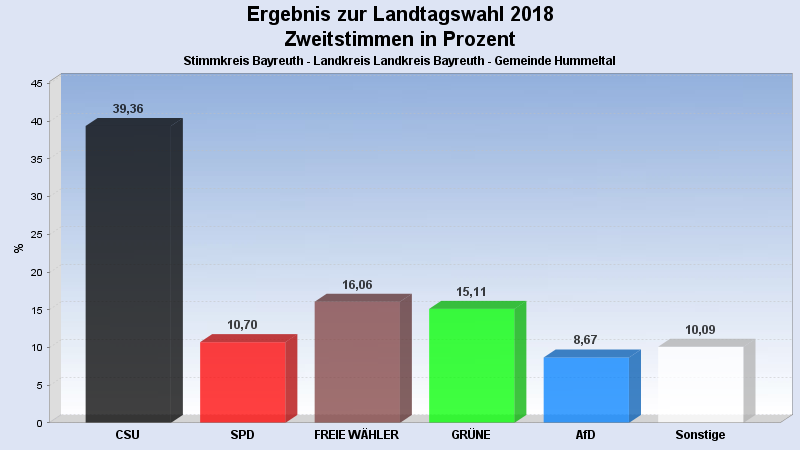
Wahlbeteiligung, Stimmzettel, Stimmen
| Wahlbeteiligung: | 76,26% |
|---|---|
| Stimmberechtigte: | 1.950 |
| Wähler: | 1.487 |
| Ungültige Erststimmen: | 6 |
| Gültige Erststimmen: | 1.481 |
| Ungültige Zweitstimmen: | 11 |
| Gültige Zweitstimmen: | 1.476 |
Erststimmen nach Wahlvorschlag
| Partei | Erststimmen | Prozent | |
|---|---|---|---|
| 1 | Brendel-Fischer, Gudrun (CSU) | 465 | 31,40% |
| 2 | Tasdelen, Halil (SPD) | 127 | 8,58% |
| 3 | Wiedemann, Florian (FREIE WÄHLER) | 487 | 32,88% |
| 4 | Pargent, Tim (GRÜNE) | 174 | 11,75% |
| 5 | Funke-Barjak, Luisa (FDP) | 33 | 2,23% |
| 6 | Sommerer, Sebastian (DIE LINKE) | 26 | 1,76% |
| 7 | Ehret, Alfred (BP) | 12 | 0,81% |
| 8 | Koppe, Bernd (ÖDP) | 11 | 0,74% |
| 10 | Rausch, Thomas (AfD) | 121 | 8,17% |
| 11 | Raithel, Christine (mut) | 6 | 0,41% |
| 12 | Kreten, Julian (Die PARTEI) | 12 | 0,81% |
| 14 | Frederking, Reinhard (V-Partei³) | 7 | 0,47% |
Zweitstimmen nach Wahlvorschlag
| Partei | Zweitstimmen | Prozent | |
|---|---|---|---|
| 1 | CSU | 581 | 39,36% |
| 2 | SPD | 158 | 10,70% |
| 3 | FREIE WÄHLER | 237 | 16,06% |
| 4 | GRÜNE | 223 | 15,11% |
| 5 | FDP | 66 | 4,47% |
| 6 | DIE LINKE | 30 | 2,03% |
| 7 | BP | 10 | 0,68% |
| 8 | ÖDP | 5 | 0,34% |
| 9 | PIRATEN | 5 | 0,34% |
| 10 | AfD | 128 | 8,67% |
| 11 | mut | 11 | 0,75% |
| 12 | Die PARTEI | 13 | 0,88% |
| 13 | Gesundheitsforschung | 2 | 0,14% |
| 14 | V-Partei³ | 7 | 0,47% |
- Stand: 22.10.2018 08:56:13