OK.Wahl
Internetpräsentation
Version 2.2.12
Ergebnis zur Landtagswahl 2018 am 14.10.2018
Stimmkreis Bayreuth - Landkreis Landkreis Bayreuth - Stadt Hollfeld
Es wurden alle Stimmbezirke ausgewertet.
 Diagramm
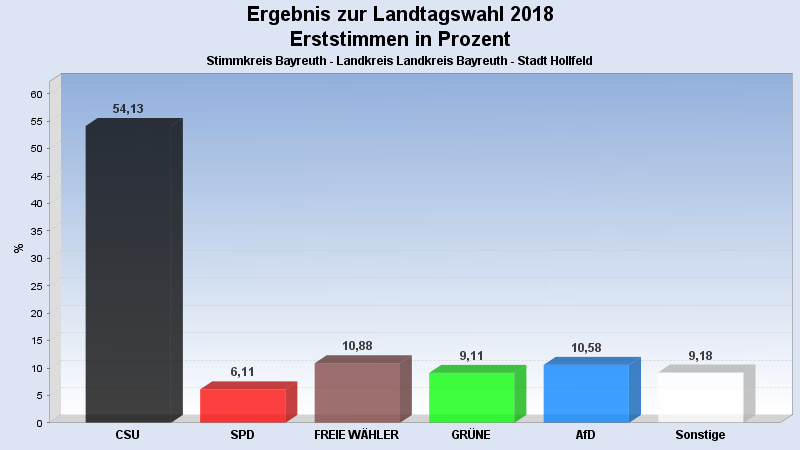
 Seitenanfang
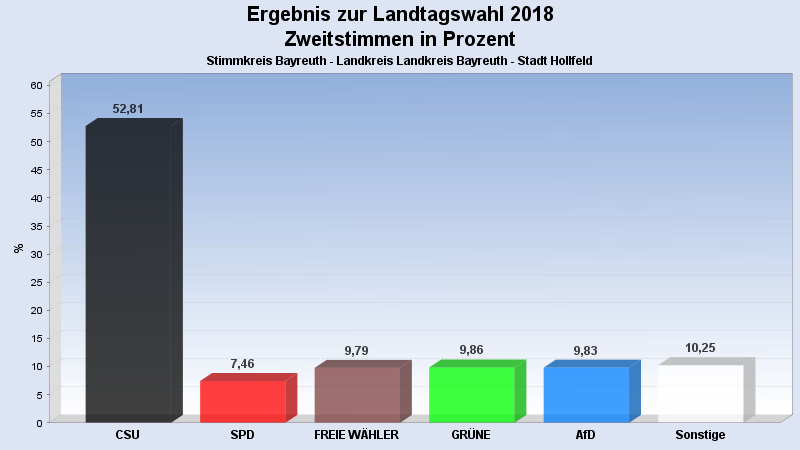
Wahlbeteiligung, Stimmzettel, Stimmen
| Wahlbeteiligung: | 74,37% |
|---|---|
| Stimmberechtigte: | 4.135 |
| Wähler: | 3.075 |
| Ungültige Erststimmen: | 14 |
| Gültige Erststimmen: | 3.061 |
| Ungültige Zweitstimmen: | 32 |
| Gültige Zweitstimmen: | 3.043 |
Erststimmen nach Wahlvorschlag
| Partei | Erststimmen | Prozent | |
|---|---|---|---|
| 1 | Brendel-Fischer, Gudrun (CSU) | 1.657 | 54,13% |
| 2 | Tasdelen, Halil (SPD) | 187 | 6,11% |
| 3 | Wiedemann, Florian (FREIE WÄHLER) | 333 | 10,88% |
| 4 | Pargent, Tim (GRÜNE) | 279 | 9,11% |
| 5 | Funke-Barjak, Luisa (FDP) | 89 | 2,91% |
| 6 | Sommerer, Sebastian (DIE LINKE) | 69 | 2,25% |
| 7 | Ehret, Alfred (BP) | 41 | 1,34% |
| 8 | Koppe, Bernd (ÖDP) | 22 | 0,72% |
| 10 | Rausch, Thomas (AfD) | 324 | 10,58% |
| 11 | Raithel, Christine (mut) | 24 | 0,78% |
| 12 | Kreten, Julian (Die PARTEI) | 30 | 0,98% |
| 14 | Frederking, Reinhard (V-Partei³) | 6 | 0,20% |
Zweitstimmen nach Wahlvorschlag
| Partei | Zweitstimmen | Prozent | |
|---|---|---|---|
| 1 | CSU | 1.607 | 52,81% |
| 2 | SPD | 227 | 7,46% |
| 3 | FREIE WÄHLER | 298 | 9,79% |
| 4 | GRÜNE | 300 | 9,86% |
| 5 | FDP | 111 | 3,65% |
| 6 | DIE LINKE | 57 | 1,87% |
| 7 | BP | 42 | 1,38% |
| 8 | ÖDP | 21 | 0,69% |
| 9 | PIRATEN | 12 | 0,39% |
| 10 | AfD | 299 | 9,83% |
| 11 | mut | 19 | 0,62% |
| 12 | Die PARTEI | 37 | 1,22% |
| 13 | Gesundheitsforschung | 7 | 0,23% |
| 14 | V-Partei³ | 6 | 0,20% |
- Stand: 22.10.2018 08:56:05