OK.Wahl
Internetpräsentation
Version 2.2.12
Ergebnis zur Landtagswahl 2018 am 14.10.2018
Stimmkreis Bayreuth - Landkreis Landkreis Bayreuth - Gemeinde Heinersreuth
Es wurden alle Stimmbezirke ausgewertet.
 Diagramm
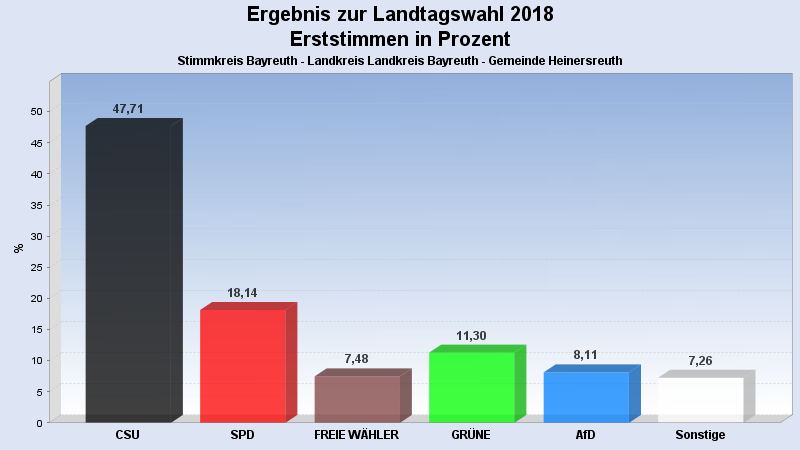
 Seitenanfang
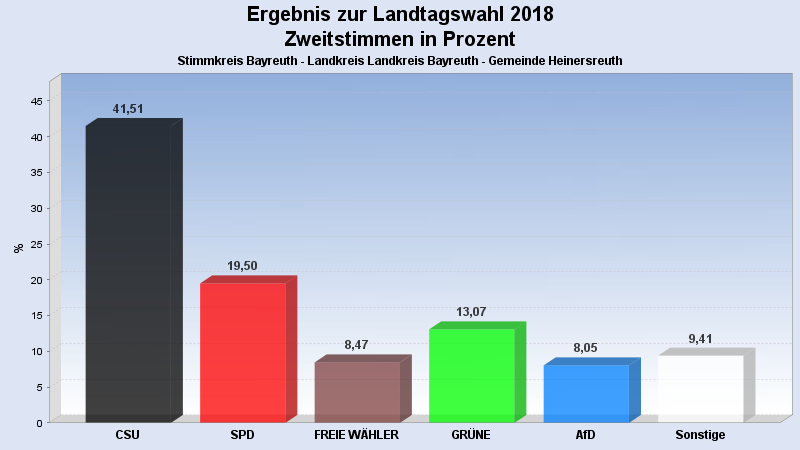
Wahlbeteiligung, Stimmzettel, Stimmen
| Wahlbeteiligung: | 76,32% |
|---|---|
| Stimmberechtigte: | 3.096 |
| Wähler: | 2.363 |
| Ungültige Erststimmen: | 9 |
| Gültige Erststimmen: | 2.354 |
| Ungültige Zweitstimmen: | 14 |
| Gültige Zweitstimmen: | 2.349 |
Erststimmen nach Wahlvorschlag
| Partei | Erststimmen | Prozent | |
|---|---|---|---|
| 1 | Brendel-Fischer, Gudrun (CSU) | 1.123 | 47,71% |
| 2 | Tasdelen, Halil (SPD) | 427 | 18,14% |
| 3 | Wiedemann, Florian (FREIE WÄHLER) | 176 | 7,48% |
| 4 | Pargent, Tim (GRÜNE) | 266 | 11,30% |
| 5 | Funke-Barjak, Luisa (FDP) | 59 | 2,51% |
| 6 | Sommerer, Sebastian (DIE LINKE) | 42 | 1,78% |
| 7 | Ehret, Alfred (BP) | 7 | 0,30% |
| 8 | Koppe, Bernd (ÖDP) | 12 | 0,51% |
| 10 | Rausch, Thomas (AfD) | 191 | 8,11% |
| 11 | Raithel, Christine (mut) | 22 | 0,93% |
| 12 | Kreten, Julian (Die PARTEI) | 21 | 0,89% |
| 14 | Frederking, Reinhard (V-Partei³) | 8 | 0,34% |
Zweitstimmen nach Wahlvorschlag
| Partei | Zweitstimmen | Prozent | |
|---|---|---|---|
| 1 | CSU | 975 | 41,51% |
| 2 | SPD | 458 | 19,50% |
| 3 | FREIE WÄHLER | 199 | 8,47% |
| 4 | GRÜNE | 307 | 13,07% |
| 5 | FDP | 99 | 4,21% |
| 6 | DIE LINKE | 46 | 1,96% |
| 7 | BP | 8 | 0,34% |
| 8 | ÖDP | 9 | 0,38% |
| 9 | PIRATEN | 7 | 0,30% |
| 10 | AfD | 189 | 8,05% |
| 11 | mut | 13 | 0,55% |
| 12 | Die PARTEI | 27 | 1,15% |
| 13 | Gesundheitsforschung | 1 | 0,04% |
| 14 | V-Partei³ | 11 | 0,47% |
- Stand: 22.10.2018 08:56:01