OK.Wahl
Internetpräsentation
Version 2.2.12
Ergebnis zur Landtagswahl 2018 am 14.10.2018
Stimmkreis Bayreuth - Landkreis Landkreis Bayreuth - Gemeinde Haag
Es wurden alle Stimmbezirke ausgewertet.
 Diagramm
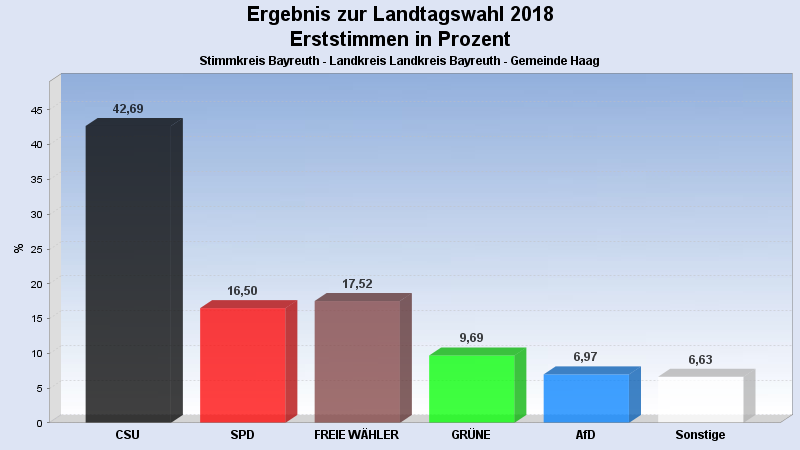
 Seitenanfang
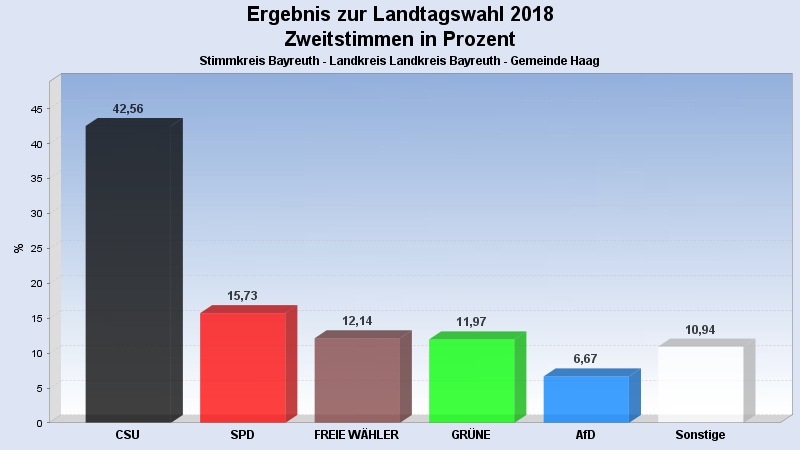
Wahlbeteiligung, Stimmzettel, Stimmen
| Wahlbeteiligung: | 79,19% |
|---|---|
| Stimmberechtigte: | 745 |
| Wähler: | 590 |
| Ungültige Erststimmen: | 2 |
| Gültige Erststimmen: | 588 |
| Ungültige Zweitstimmen: | 5 |
| Gültige Zweitstimmen: | 585 |
Erststimmen nach Wahlvorschlag
| Partei | Erststimmen | Prozent | |
|---|---|---|---|
| 1 | Brendel-Fischer, Gudrun (CSU) | 251 | 42,69% |
| 2 | Tasdelen, Halil (SPD) | 97 | 16,50% |
| 3 | Wiedemann, Florian (FREIE WÄHLER) | 103 | 17,52% |
| 4 | Pargent, Tim (GRÜNE) | 57 | 9,69% |
| 5 | Funke-Barjak, Luisa (FDP) | 9 | 1,53% |
| 6 | Sommerer, Sebastian (DIE LINKE) | 11 | 1,87% |
| 7 | Ehret, Alfred (BP) | 9 | 1,53% |
| 8 | Koppe, Bernd (ÖDP) | 0 | 0,00% |
| 10 | Rausch, Thomas (AfD) | 41 | 6,97% |
| 11 | Raithel, Christine (mut) | 3 | 0,51% |
| 12 | Kreten, Julian (Die PARTEI) | 6 | 1,02% |
| 14 | Frederking, Reinhard (V-Partei³) | 1 | 0,17% |
Zweitstimmen nach Wahlvorschlag
| Partei | Zweitstimmen | Prozent | |
|---|---|---|---|
| 1 | CSU | 249 | 42,56% |
| 2 | SPD | 92 | 15,73% |
| 3 | FREIE WÄHLER | 71 | 12,14% |
| 4 | GRÜNE | 70 | 11,97% |
| 5 | FDP | 18 | 3,08% |
| 6 | DIE LINKE | 16 | 2,74% |
| 7 | BP | 10 | 1,71% |
| 8 | ÖDP | 1 | 0,17% |
| 9 | PIRATEN | 2 | 0,34% |
| 10 | AfD | 39 | 6,67% |
| 11 | mut | 7 | 1,20% |
| 12 | Die PARTEI | 8 | 1,37% |
| 13 | Gesundheitsforschung | 1 | 0,17% |
| 14 | V-Partei³ | 1 | 0,17% |
- Stand: 22.10.2018 08:55:59