OK.Wahl
Internetpräsentation
Version 2.2.12
Ergebnis zur Landtagswahl 2018 am 14.10.2018
Stimmkreis Bayreuth - Landkreis Landkreis Bayreuth - Stadt Goldkronach
Es wurden alle Stimmbezirke ausgewertet.
 Diagramm
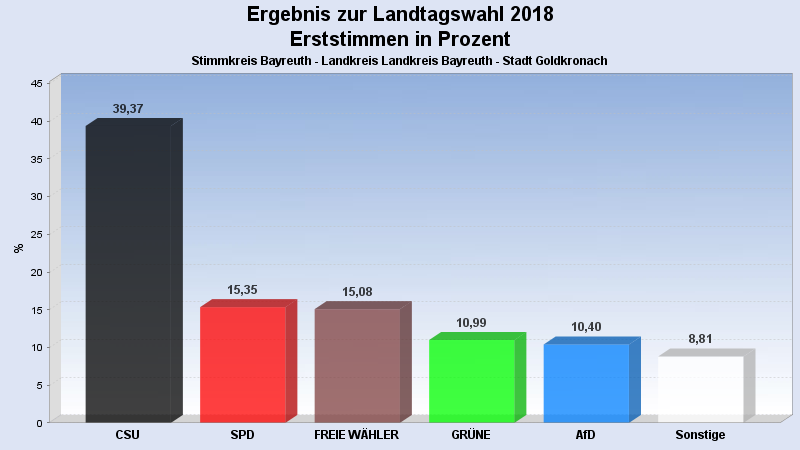
 Seitenanfang
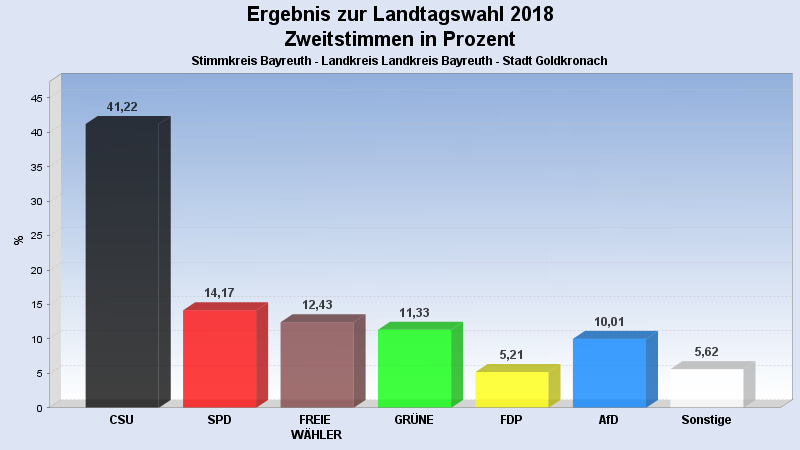
Wahlbeteiligung, Stimmzettel, Stimmen
| Wahlbeteiligung: | 76,90% |
|---|---|
| Stimmberechtigte: | 2.883 |
| Wähler: | 2.217 |
| Ungültige Erststimmen: | 15 |
| Gültige Erststimmen: | 2.202 |
| Ungültige Zweitstimmen: | 29 |
| Gültige Zweitstimmen: | 2.188 |
Erststimmen nach Wahlvorschlag
| Partei | Erststimmen | Prozent | |
|---|---|---|---|
| 1 | Brendel-Fischer, Gudrun (CSU) | 867 | 39,37% |
| 2 | Tasdelen, Halil (SPD) | 338 | 15,35% |
| 3 | Wiedemann, Florian (FREIE WÄHLER) | 332 | 15,08% |
| 4 | Pargent, Tim (GRÜNE) | 242 | 10,99% |
| 5 | Funke-Barjak, Luisa (FDP) | 83 | 3,77% |
| 6 | Sommerer, Sebastian (DIE LINKE) | 44 | 2,00% |
| 7 | Ehret, Alfred (BP) | 18 | 0,82% |
| 8 | Koppe, Bernd (ÖDP) | 16 | 0,73% |
| 10 | Rausch, Thomas (AfD) | 229 | 10,40% |
| 11 | Raithel, Christine (mut) | 12 | 0,54% |
| 12 | Kreten, Julian (Die PARTEI) | 15 | 0,68% |
| 14 | Frederking, Reinhard (V-Partei³) | 6 | 0,27% |
Zweitstimmen nach Wahlvorschlag
| Partei | Zweitstimmen | Prozent | |
|---|---|---|---|
| 1 | CSU | 902 | 41,22% |
| 2 | SPD | 310 | 14,17% |
| 3 | FREIE WÄHLER | 272 | 12,43% |
| 4 | GRÜNE | 248 | 11,33% |
| 5 | FDP | 114 | 5,21% |
| 6 | DIE LINKE | 51 | 2,33% |
| 7 | BP | 11 | 0,50% |
| 8 | ÖDP | 16 | 0,73% |
| 9 | PIRATEN | 6 | 0,27% |
| 10 | AfD | 219 | 10,01% |
| 11 | mut | 10 | 0,46% |
| 12 | Die PARTEI | 14 | 0,64% |
| 13 | Gesundheitsforschung | 7 | 0,32% |
| 14 | V-Partei³ | 8 | 0,37% |
- Stand: 22.10.2018 08:55:52