OK.Wahl
Internetpräsentation
Version 2.2.12
Ergebnis zur Landtagswahl 2018 am 14.10.2018
Stimmkreis Bayreuth - Landkreis Landkreis Bayreuth - Gemeinde Gesees
Es wurden alle Stimmbezirke ausgewertet.
 Diagramm
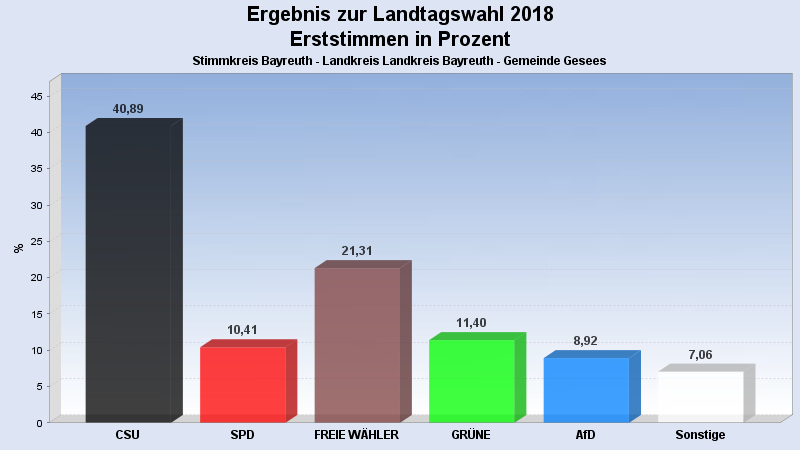
 Seitenanfang
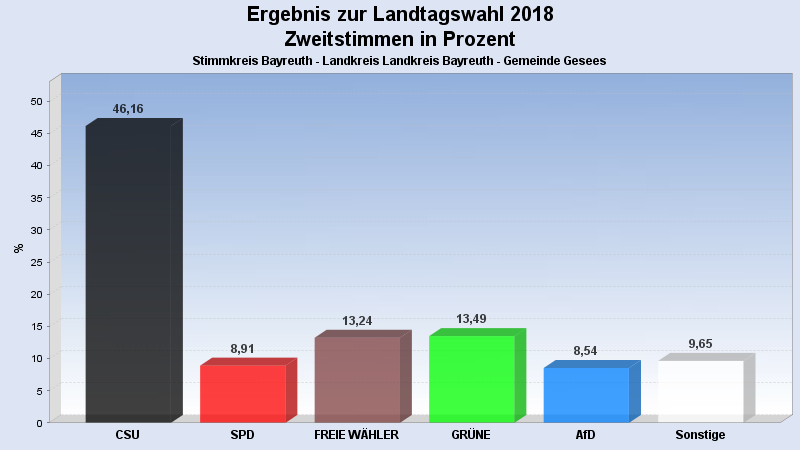
Wahlbeteiligung, Stimmzettel, Stimmen
| Wahlbeteiligung: | 79,47% |
|---|---|
| Stimmberechtigte: | 1.023 |
| Wähler: | 813 |
| Ungültige Erststimmen: | 6 |
| Gültige Erststimmen: | 807 |
| Ungültige Zweitstimmen: | 5 |
| Gültige Zweitstimmen: | 808 |
Erststimmen nach Wahlvorschlag
| Partei | Erststimmen | Prozent | |
|---|---|---|---|
| 1 | Brendel-Fischer, Gudrun (CSU) | 330 | 40,89% |
| 2 | Tasdelen, Halil (SPD) | 84 | 10,41% |
| 3 | Wiedemann, Florian (FREIE WÄHLER) | 172 | 21,31% |
| 4 | Pargent, Tim (GRÜNE) | 92 | 11,40% |
| 5 | Funke-Barjak, Luisa (FDP) | 19 | 2,35% |
| 6 | Sommerer, Sebastian (DIE LINKE) | 9 | 1,12% |
| 7 | Ehret, Alfred (BP) | 7 | 0,87% |
| 8 | Koppe, Bernd (ÖDP) | 5 | 0,62% |
| 10 | Rausch, Thomas (AfD) | 72 | 8,92% |
| 11 | Raithel, Christine (mut) | 5 | 0,62% |
| 12 | Kreten, Julian (Die PARTEI) | 8 | 0,99% |
| 14 | Frederking, Reinhard (V-Partei³) | 4 | 0,50% |
Zweitstimmen nach Wahlvorschlag
| Partei | Zweitstimmen | Prozent | |
|---|---|---|---|
| 1 | CSU | 373 | 46,16% |
| 2 | SPD | 72 | 8,91% |
| 3 | FREIE WÄHLER | 107 | 13,24% |
| 4 | GRÜNE | 109 | 13,49% |
| 5 | FDP | 37 | 4,58% |
| 6 | DIE LINKE | 15 | 1,86% |
| 7 | BP | 6 | 0,74% |
| 8 | ÖDP | 2 | 0,25% |
| 9 | PIRATEN | 2 | 0,25% |
| 10 | AfD | 69 | 8,54% |
| 11 | mut | 6 | 0,74% |
| 12 | Die PARTEI | 7 | 0,87% |
| 13 | Gesundheitsforschung | 0 | 0,00% |
| 14 | V-Partei³ | 3 | 0,37% |
- Stand: 22.10.2018 08:55:47