OK.Wahl
Internetpräsentation
Version 2.2.12
Ergebnis zur Landtagswahl 2018 am 14.10.2018
Stimmkreis Bayreuth - Landkreis Landkreis Bayreuth - Gemeinde Emtmannsberg
Es wurden alle Stimmbezirke ausgewertet.
 Diagramm
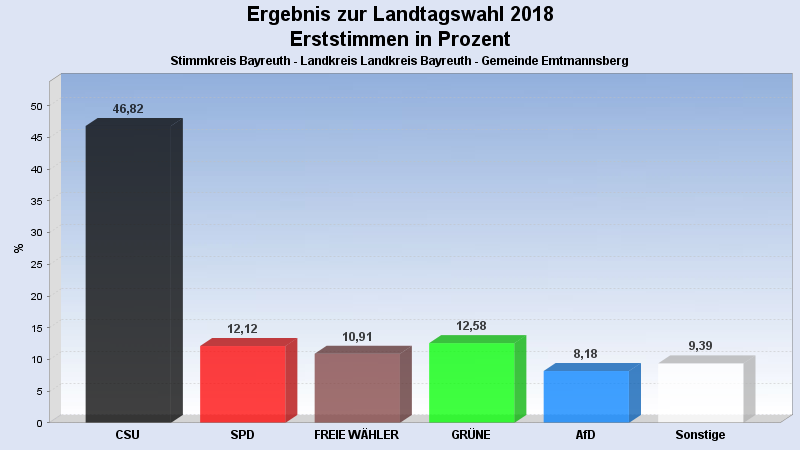
 Seitenanfang
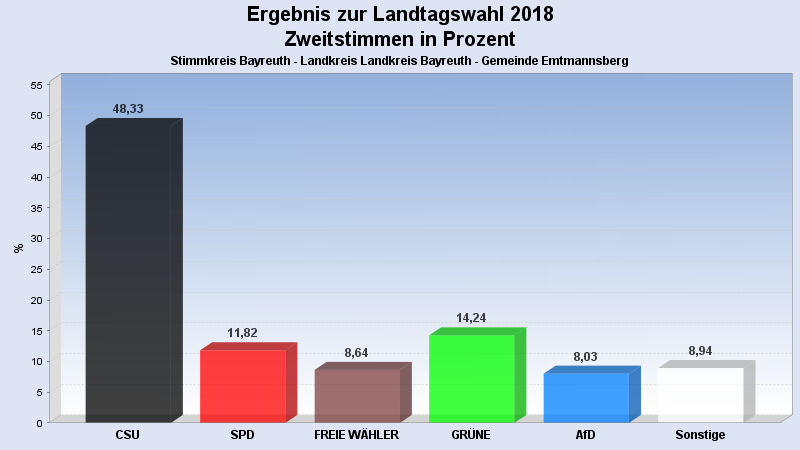
Wahlbeteiligung, Stimmzettel, Stimmen
| Wahlbeteiligung: | 78,05% |
|---|---|
| Stimmberechtigte: | 852 |
| Wähler: | 665 |
| Ungültige Erststimmen: | 5 |
| Gültige Erststimmen: | 660 |
| Ungültige Zweitstimmen: | 5 |
| Gültige Zweitstimmen: | 660 |
Erststimmen nach Wahlvorschlag
| Partei | Erststimmen | Prozent | |
|---|---|---|---|
| 1 | Brendel-Fischer, Gudrun (CSU) | 309 | 46,82% |
| 2 | Tasdelen, Halil (SPD) | 80 | 12,12% |
| 3 | Wiedemann, Florian (FREIE WÄHLER) | 72 | 10,91% |
| 4 | Pargent, Tim (GRÜNE) | 83 | 12,58% |
| 5 | Funke-Barjak, Luisa (FDP) | 24 | 3,64% |
| 6 | Sommerer, Sebastian (DIE LINKE) | 16 | 2,42% |
| 7 | Ehret, Alfred (BP) | 6 | 0,91% |
| 8 | Koppe, Bernd (ÖDP) | 6 | 0,91% |
| 10 | Rausch, Thomas (AfD) | 54 | 8,18% |
| 11 | Raithel, Christine (mut) | 2 | 0,30% |
| 12 | Kreten, Julian (Die PARTEI) | 3 | 0,45% |
| 14 | Frederking, Reinhard (V-Partei³) | 5 | 0,76% |
Zweitstimmen nach Wahlvorschlag
| Partei | Zweitstimmen | Prozent | |
|---|---|---|---|
| 1 | CSU | 319 | 48,33% |
| 2 | SPD | 78 | 11,82% |
| 3 | FREIE WÄHLER | 57 | 8,64% |
| 4 | GRÜNE | 94 | 14,24% |
| 5 | FDP | 27 | 4,09% |
| 6 | DIE LINKE | 14 | 2,12% |
| 7 | BP | 3 | 0,45% |
| 8 | ÖDP | 3 | 0,45% |
| 9 | PIRATEN | 1 | 0,15% |
| 10 | AfD | 53 | 8,03% |
| 11 | mut | 2 | 0,30% |
| 12 | Die PARTEI | 3 | 0,45% |
| 13 | Gesundheitsforschung | 1 | 0,15% |
| 14 | V-Partei³ | 5 | 0,76% |
- Stand: 22.10.2018 08:55:44