OK.Wahl
Internetpräsentation
Version 2.2.12
Ergebnis zur Landtagswahl 2018 am 14.10.2018
Stimmkreis Bayreuth - Landkreis Landkreis Bayreuth - Stadt Creußen
Es wurden alle Stimmbezirke ausgewertet.
 Diagramm
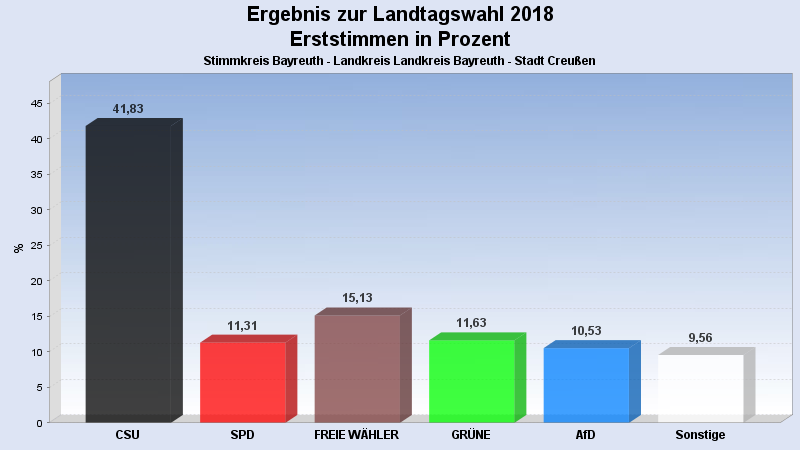
 Seitenanfang
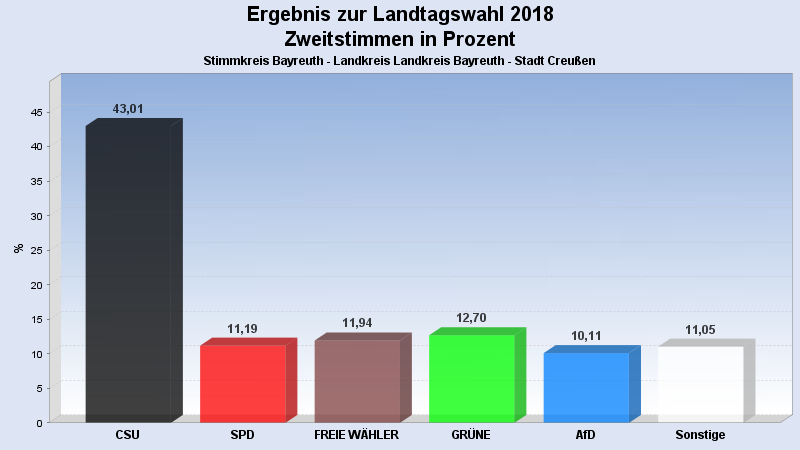
Wahlbeteiligung, Stimmzettel, Stimmen
| Wahlbeteiligung: | 71,61% |
|---|---|
| Stimmberechtigte: | 3.938 |
| Wähler: | 2.820 |
| Ungültige Erststimmen: | 18 |
| Gültige Erststimmen: | 2.802 |
| Ungültige Zweitstimmen: | 32 |
| Gültige Zweitstimmen: | 2.788 |
Erststimmen nach Wahlvorschlag
| Partei | Erststimmen | Prozent | |
|---|---|---|---|
| 1 | Brendel-Fischer, Gudrun (CSU) | 1.172 | 41,83% |
| 2 | Tasdelen, Halil (SPD) | 317 | 11,31% |
| 3 | Wiedemann, Florian (FREIE WÄHLER) | 424 | 15,13% |
| 4 | Pargent, Tim (GRÜNE) | 326 | 11,63% |
| 5 | Funke-Barjak, Luisa (FDP) | 104 | 3,71% |
| 6 | Sommerer, Sebastian (DIE LINKE) | 66 | 2,36% |
| 7 | Ehret, Alfred (BP) | 28 | 1,00% |
| 8 | Koppe, Bernd (ÖDP) | 14 | 0,50% |
| 10 | Rausch, Thomas (AfD) | 295 | 10,53% |
| 11 | Raithel, Christine (mut) | 20 | 0,71% |
| 12 | Kreten, Julian (Die PARTEI) | 30 | 1,07% |
| 14 | Frederking, Reinhard (V-Partei³) | 6 | 0,21% |
Zweitstimmen nach Wahlvorschlag
| Partei | Zweitstimmen | Prozent | |
|---|---|---|---|
| 1 | CSU | 1.199 | 43,01% |
| 2 | SPD | 312 | 11,19% |
| 3 | FREIE WÄHLER | 333 | 11,94% |
| 4 | GRÜNE | 354 | 12,70% |
| 5 | FDP | 133 | 4,77% |
| 6 | DIE LINKE | 64 | 2,30% |
| 7 | BP | 26 | 0,93% |
| 8 | ÖDP | 14 | 0,50% |
| 9 | PIRATEN | 15 | 0,54% |
| 10 | AfD | 282 | 10,11% |
| 11 | mut | 20 | 0,72% |
| 12 | Die PARTEI | 18 | 0,65% |
| 13 | Gesundheitsforschung | 8 | 0,29% |
| 14 | V-Partei³ | 10 | 0,36% |
- Stand: 22.10.2018 08:55:27