OK.Wahl
Internetpräsentation
Version 2.2.12
Ergebnis zur Landtagswahl 2018 am 14.10.2018
Stimmkreis Bayreuth - Landkreis Landkreis Bayreuth - Stadt Betzenstein
Es wurden alle Stimmbezirke ausgewertet.
 Diagramm
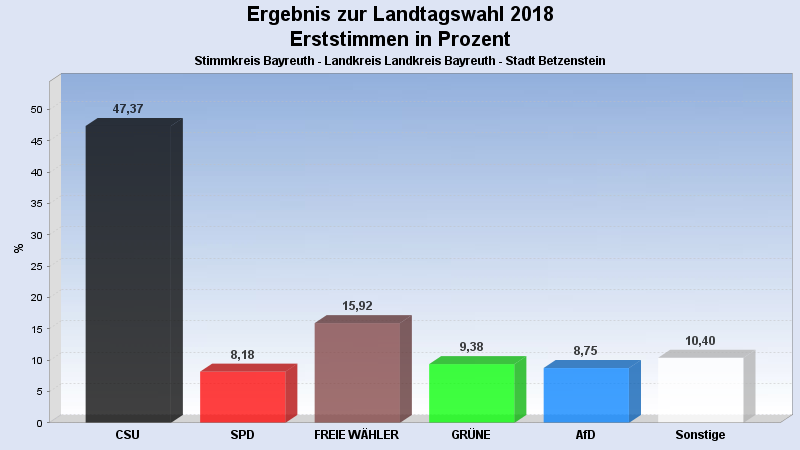
 Seitenanfang
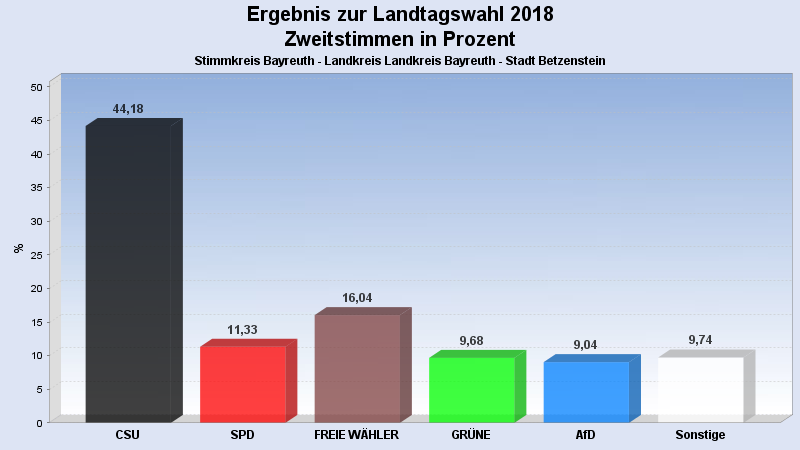
Wahlbeteiligung, Stimmzettel, Stimmen
| Wahlbeteiligung: | 77,85% |
|---|---|
| Stimmberechtigte: | 2.032 |
| Wähler: | 1.582 |
| Ungültige Erststimmen: | 5 |
| Gültige Erststimmen: | 1.577 |
| Ungültige Zweitstimmen: | 11 |
| Gültige Zweitstimmen: | 1.571 |
Erststimmen nach Wahlvorschlag
| Partei | Erststimmen | Prozent | |
|---|---|---|---|
| 1 | Brendel-Fischer, Gudrun (CSU) | 747 | 47,37% |
| 2 | Tasdelen, Halil (SPD) | 129 | 8,18% |
| 3 | Wiedemann, Florian (FREIE WÄHLER) | 251 | 15,92% |
| 4 | Pargent, Tim (GRÜNE) | 148 | 9,38% |
| 5 | Funke-Barjak, Luisa (FDP) | 39 | 2,47% |
| 6 | Sommerer, Sebastian (DIE LINKE) | 52 | 3,30% |
| 7 | Ehret, Alfred (BP) | 15 | 0,95% |
| 8 | Koppe, Bernd (ÖDP) | 6 | 0,38% |
| 10 | Rausch, Thomas (AfD) | 138 | 8,75% |
| 11 | Raithel, Christine (mut) | 7 | 0,44% |
| 12 | Kreten, Julian (Die PARTEI) | 21 | 1,33% |
| 14 | Frederking, Reinhard (V-Partei³) | 24 | 1,52% |
Zweitstimmen nach Wahlvorschlag
| Partei | Zweitstimmen | Prozent | |
|---|---|---|---|
| 1 | CSU | 694 | 44,18% |
| 2 | SPD | 178 | 11,33% |
| 3 | FREIE WÄHLER | 252 | 16,04% |
| 4 | GRÜNE | 152 | 9,68% |
| 5 | FDP | 38 | 2,42% |
| 6 | DIE LINKE | 48 | 3,06% |
| 7 | BP | 14 | 0,89% |
| 8 | ÖDP | 5 | 0,32% |
| 9 | PIRATEN | 13 | 0,83% |
| 10 | AfD | 142 | 9,04% |
| 11 | mut | 3 | 0,19% |
| 12 | Die PARTEI | 13 | 0,83% |
| 13 | Gesundheitsforschung | 1 | 0,06% |
| 14 | V-Partei³ | 18 | 1,15% |
- Stand: 22.10.2018 08:55:14