OK.Wahl
Internetpräsentation
Version 2.2.12
Ergebnis zur Landtagswahl 2018 am 14.10.2018
Stimmkreis Bayreuth - Landkreis Landkreis Bayreuth - Gemeinde Ahorntal
Es wurden alle Stimmbezirke ausgewertet.
 Diagramm
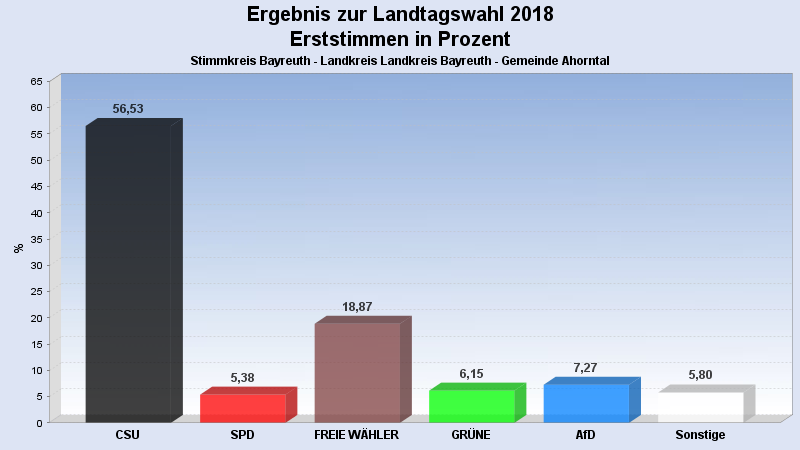
 Seitenanfang
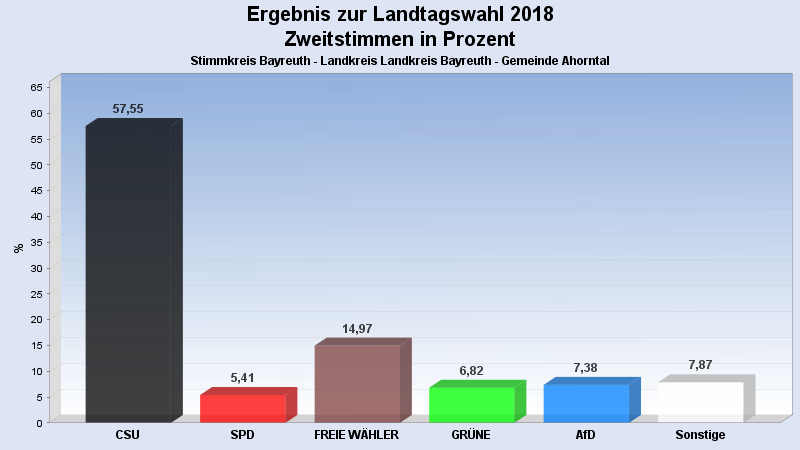
Wahlbeteiligung, Stimmzettel, Stimmen
| Wahlbeteiligung: | 82,95% |
|---|---|
| Stimmberechtigte: | 1.736 |
| Wähler: | 1.440 |
| Ungültige Erststimmen: | 9 |
| Gültige Erststimmen: | 1.431 |
| Ungültige Zweitstimmen: | 17 |
| Gültige Zweitstimmen: | 1.423 |
Erststimmen nach Wahlvorschlag
| Partei | Erststimmen | Prozent | |
|---|---|---|---|
| 1 | Brendel-Fischer, Gudrun (CSU) | 809 | 56,53% |
| 2 | Tasdelen, Halil (SPD) | 77 | 5,38% |
| 3 | Wiedemann, Florian (FREIE WÄHLER) | 270 | 18,87% |
| 4 | Pargent, Tim (GRÜNE) | 88 | 6,15% |
| 5 | Funke-Barjak, Luisa (FDP) | 32 | 2,24% |
| 6 | Sommerer, Sebastian (DIE LINKE) | 12 | 0,84% |
| 7 | Ehret, Alfred (BP) | 7 | 0,49% |
| 8 | Koppe, Bernd (ÖDP) | 11 | 0,77% |
| 10 | Rausch, Thomas (AfD) | 104 | 7,27% |
| 11 | Raithel, Christine (mut) | 10 | 0,70% |
| 12 | Kreten, Julian (Die PARTEI) | 8 | 0,56% |
| 14 | Frederking, Reinhard (V-Partei³) | 3 | 0,21% |
Zweitstimmen nach Wahlvorschlag
| Partei | Zweitstimmen | Prozent | |
|---|---|---|---|
| 1 | CSU | 819 | 57,55% |
| 2 | SPD | 77 | 5,41% |
| 3 | FREIE WÄHLER | 213 | 14,97% |
| 4 | GRÜNE | 97 | 6,82% |
| 5 | FDP | 51 | 3,58% |
| 6 | DIE LINKE | 17 | 1,19% |
| 7 | BP | 6 | 0,42% |
| 8 | ÖDP | 11 | 0,77% |
| 9 | PIRATEN | 4 | 0,28% |
| 10 | AfD | 105 | 7,38% |
| 11 | mut | 10 | 0,70% |
| 12 | Die PARTEI | 7 | 0,49% |
| 13 | Gesundheitsforschung | 2 | 0,14% |
| 14 | V-Partei³ | 4 | 0,28% |
- Stand: 22.10.2018 08:55:05