OK.Wahl
Internetpräsentation
Version 2.2.7
Ergebnis zur Bezirkswahl 2013 am 15.09.2013
Stimmkreis Bayreuth - Landkreis Landkreis Bayreuth - Markt Weidenberg
Es wurden alle Stimmbezirke ausgewertet.
 Diagramm
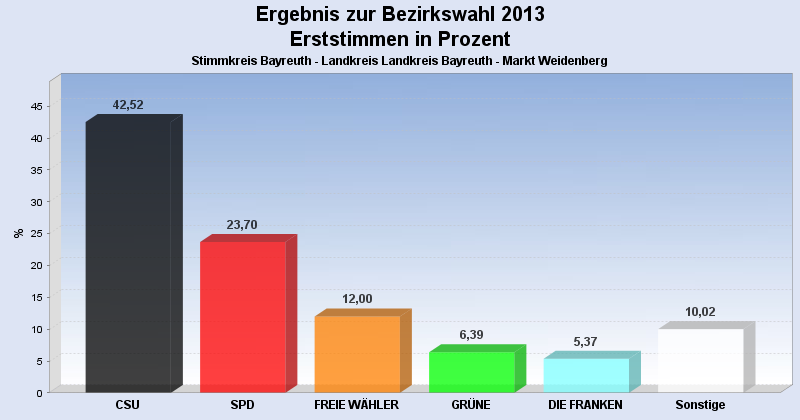
 Seitenanfang
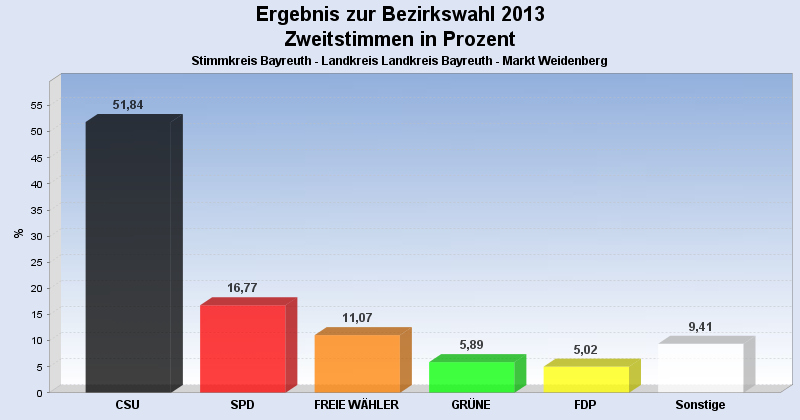
Wahlbeteiligung, Stimmzettel, Stimmen
| Wahlbeteiligung: | 66,69% |
|---|---|
| Stimmberechtigte: | 4.906 |
| Wähler: | 3.272 |
| Ungültige Erststimmen: | 48 |
| Gültige Erststimmen: | 3.224 |
| Ungültige Zweitstimmen: | 64 |
| Gültige Zweitstimmen: | 3.208 |
Erststimmen nach Wahlvorschlag
| Partei | Erststimmen | Prozent | |
|---|---|---|---|
| 1 | Dr. Specht, Stefan ( CSU ) | 1.371 | 42,52% |
| 2 | Dr. Kuhn, Beate ( SPD ) | 764 | 23,70% |
| 3 | Frühbeißer, Stefan ( FREIE WÄHLER ) | 387 | 12,00% |
| 4 | Pargent, Tim ( GRÜNE ) | 206 | 6,39% |
| 5 | Dr. Schweingel, Dieter ( FDP ) | 103 | 3,19% |
| 6 | Böhner, Georg ( DIE LINKE ) | 56 | 1,74% |
| 7 | Zimmermann, Konrad ( ÖDP ) | 38 | 1,18% |
| 8 | Prechtl, Hermann ( REP ) | 28 | 0,87% |
| 9 | Blankenburg, Moroni ( NPD ) | 24 | 0,74% |
| 10 | Schneider, Jürgen ( BP ) | 14 | 0,43% |
| 12 | Dressendörfer, Horst ( DIE FRANKEN ) | 173 | 5,37% |
| 13 | Gudat, Max ( PIRATEN ) | 60 | 1,86% |
Zweitstimmen nach Wahlvorschlag
| Partei | Zweitstimmen | Prozent | |
|---|---|---|---|
| 1 | CSU | 1.663 | 51,84% |
| 2 | SPD | 538 | 16,77% |
| 3 | FREIE WÄHLER | 355 | 11,07% |
| 4 | GRÜNE | 189 | 5,89% |
| 5 | FDP | 161 | 5,02% |
| 6 | DIE LINKE | 61 | 1,90% |
| 7 | ÖDP | 28 | 0,87% |
| 8 | REP | 25 | 0,78% |
| 9 | NPD | 25 | 0,78% |
| 10 | BP | 11 | 0,34% |
| 11 | FRAUENLISTE | 18 | 0,56% |
| 12 | DIE FRANKEN | 84 | 2,62% |
| 13 | PIRATEN | 50 | 1,56% |
- Stand: 22.09.2013 16:55:35