OK.Wahl
Internetpräsentation
Version 2.2.7
Ergebnis zur Bezirkswahl 2013 am 15.09.2013
Stimmkreis Bayreuth - Landkreis Landkreis Bayreuth - Gemeinde Seybothenreuth
Es wurden alle Stimmbezirke ausgewertet.
 Diagramm
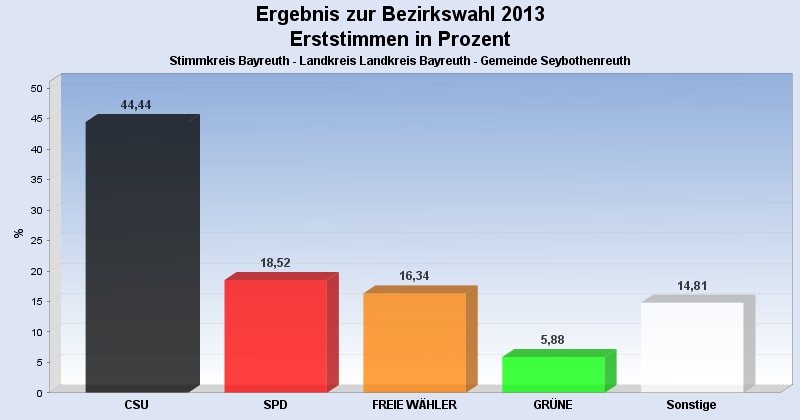
 Seitenanfang
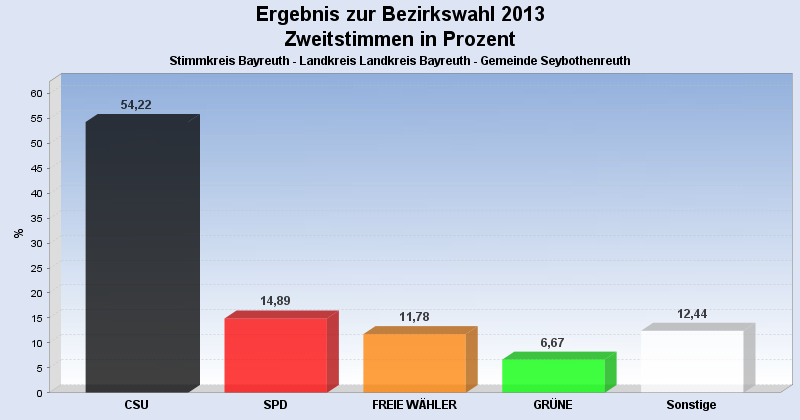
Wahlbeteiligung, Stimmzettel, Stimmen
| Wahlbeteiligung: | 48,03% |
|---|---|
| Stimmberechtigte: | 964 |
| Wähler: | 463 |
| Ungültige Erststimmen: | 4 |
| Gültige Erststimmen: | 459 |
| Ungültige Zweitstimmen: | 13 |
| Gültige Zweitstimmen: | 450 |
Erststimmen nach Wahlvorschlag
| Partei | Erststimmen | Prozent | |
|---|---|---|---|
| 1 | Dr. Specht, Stefan ( CSU ) | 204 | 44,44% |
| 2 | Dr. Kuhn, Beate ( SPD ) | 85 | 18,52% |
| 3 | Frühbeißer, Stefan ( FREIE WÄHLER ) | 75 | 16,34% |
| 4 | Pargent, Tim ( GRÜNE ) | 27 | 5,88% |
| 5 | Dr. Schweingel, Dieter ( FDP ) | 20 | 4,36% |
| 6 | Böhner, Georg ( DIE LINKE ) | 11 | 2,40% |
| 7 | Zimmermann, Konrad ( ÖDP ) | 4 | 0,87% |
| 8 | Prechtl, Hermann ( REP ) | 1 | 0,22% |
| 9 | Blankenburg, Moroni ( NPD ) | 8 | 1,74% |
| 10 | Schneider, Jürgen ( BP ) | 0 | 0,00% |
| 12 | Dressendörfer, Horst ( DIE FRANKEN ) | 15 | 3,27% |
| 13 | Gudat, Max ( PIRATEN ) | 9 | 1,96% |
Zweitstimmen nach Wahlvorschlag
| Partei | Zweitstimmen | Prozent | |
|---|---|---|---|
| 1 | CSU | 244 | 54,22% |
| 2 | SPD | 67 | 14,89% |
| 3 | FREIE WÄHLER | 53 | 11,78% |
| 4 | GRÜNE | 30 | 6,67% |
| 5 | FDP | 11 | 2,44% |
| 6 | DIE LINKE | 7 | 1,56% |
| 7 | ÖDP | 5 | 1,11% |
| 8 | REP | 3 | 0,67% |
| 9 | NPD | 5 | 1,11% |
| 10 | BP | 1 | 0,22% |
| 11 | FRAUENLISTE | 2 | 0,44% |
| 12 | DIE FRANKEN | 11 | 2,44% |
| 13 | PIRATEN | 11 | 2,44% |
- Stand: 22.09.2013 16:55:23