OK.Wahl
Internetpräsentation
Version 2.2.7
Ergebnis zur Bezirkswahl 2013 am 15.09.2013
Stimmkreis Bayreuth - Landkreis Landkreis Bayreuth - Gemeinde Prebitz
Es wurden alle Stimmbezirke ausgewertet.
 Diagramm
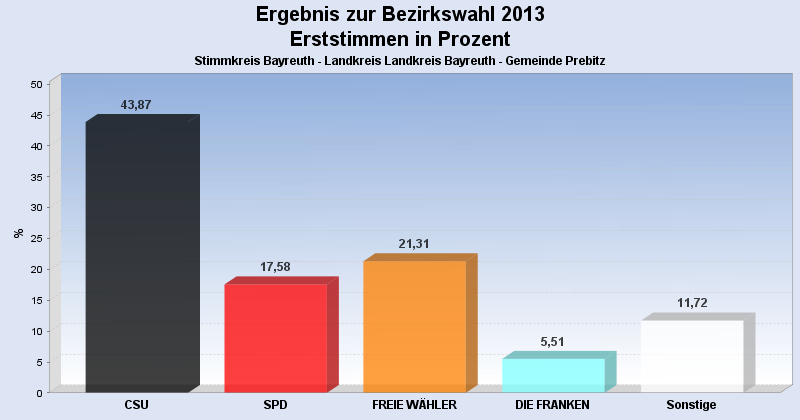
 Seitenanfang
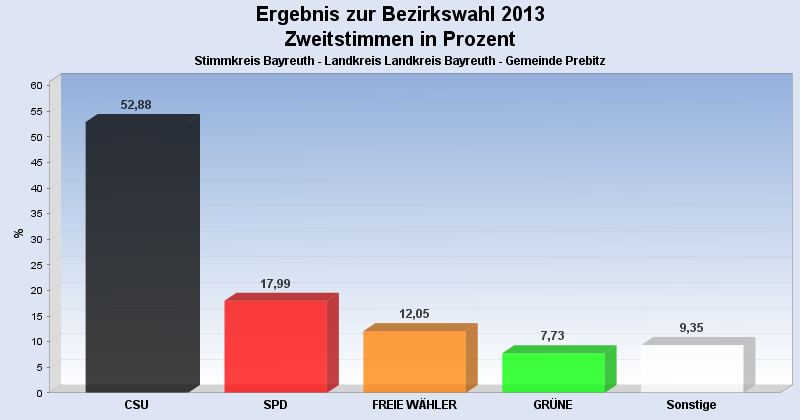
Wahlbeteiligung, Stimmzettel, Stimmen
| Wahlbeteiligung: | 68,15% |
|---|---|
| Stimmberechtigte: | 829 |
| Wähler: | 565 |
| Ungültige Erststimmen: | 2 |
| Gültige Erststimmen: | 563 |
| Ungültige Zweitstimmen: | 9 |
| Gültige Zweitstimmen: | 556 |
Erststimmen nach Wahlvorschlag
| Partei | Erststimmen | Prozent | |
|---|---|---|---|
| 1 | Dr. Specht, Stefan ( CSU ) | 247 | 43,87% |
| 2 | Dr. Kuhn, Beate ( SPD ) | 99 | 17,58% |
| 3 | Frühbeißer, Stefan ( FREIE WÄHLER ) | 120 | 21,31% |
| 4 | Pargent, Tim ( GRÜNE ) | 20 | 3,55% |
| 5 | Dr. Schweingel, Dieter ( FDP ) | 9 | 1,60% |
| 6 | Böhner, Georg ( DIE LINKE ) | 14 | 2,49% |
| 7 | Zimmermann, Konrad ( ÖDP ) | 5 | 0,89% |
| 8 | Prechtl, Hermann ( REP ) | 1 | 0,18% |
| 9 | Blankenburg, Moroni ( NPD ) | 5 | 0,89% |
| 10 | Schneider, Jürgen ( BP ) | 8 | 1,42% |
| 12 | Dressendörfer, Horst ( DIE FRANKEN ) | 31 | 5,51% |
| 13 | Gudat, Max ( PIRATEN ) | 4 | 0,71% |
Zweitstimmen nach Wahlvorschlag
| Partei | Zweitstimmen | Prozent | |
|---|---|---|---|
| 1 | CSU | 294 | 52,88% |
| 2 | SPD | 100 | 17,99% |
| 3 | FREIE WÄHLER | 67 | 12,05% |
| 4 | GRÜNE | 43 | 7,73% |
| 5 | FDP | 5 | 0,90% |
| 6 | DIE LINKE | 9 | 1,62% |
| 7 | ÖDP | 5 | 0,90% |
| 8 | REP | 6 | 1,08% |
| 9 | NPD | 4 | 0,72% |
| 10 | BP | 6 | 1,08% |
| 11 | FRAUENLISTE | 1 | 0,18% |
| 12 | DIE FRANKEN | 14 | 2,52% |
| 13 | PIRATEN | 2 | 0,36% |
- Stand: 22.09.2013 16:55:20