OK.Wahl
Internetpräsentation
Version 2.2.7
Ergebnis zur Bezirkswahl 2013 am 15.09.2013
Stimmkreis Bayreuth - Landkreis Landkreis Bayreuth - Markt Plech
Es wurden alle Stimmbezirke ausgewertet.
 Diagramm
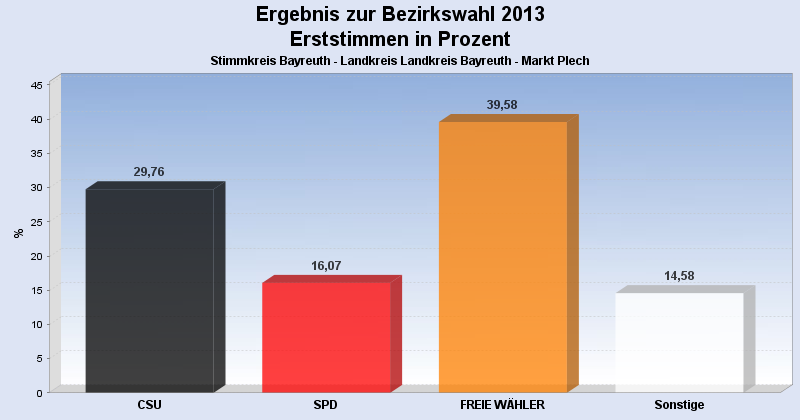
 Seitenanfang
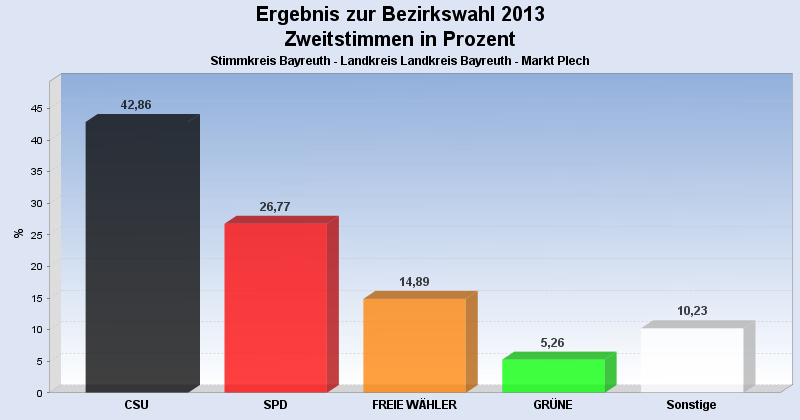
Wahlbeteiligung, Stimmzettel, Stimmen
| Wahlbeteiligung: | 67,53% |
|---|---|
| Stimmberechtigte: | 1.001 |
| Wähler: | 676 |
| Ungültige Erststimmen: | 4 |
| Gültige Erststimmen: | 672 |
| Ungültige Zweitstimmen: | 11 |
| Gültige Zweitstimmen: | 665 |
Erststimmen nach Wahlvorschlag
| Partei | Erststimmen | Prozent | |
|---|---|---|---|
| 1 | Dr. Specht, Stefan ( CSU ) | 200 | 29,76% |
| 2 | Dr. Kuhn, Beate ( SPD ) | 108 | 16,07% |
| 3 | Frühbeißer, Stefan ( FREIE WÄHLER ) | 266 | 39,58% |
| 4 | Pargent, Tim ( GRÜNE ) | 31 | 4,61% |
| 5 | Dr. Schweingel, Dieter ( FDP ) | 10 | 1,49% |
| 6 | Böhner, Georg ( DIE LINKE ) | 13 | 1,93% |
| 7 | Zimmermann, Konrad ( ÖDP ) | 4 | 0,60% |
| 8 | Prechtl, Hermann ( REP ) | 5 | 0,74% |
| 9 | Blankenburg, Moroni ( NPD ) | 5 | 0,74% |
| 10 | Schneider, Jürgen ( BP ) | 4 | 0,60% |
| 12 | Dressendörfer, Horst ( DIE FRANKEN ) | 19 | 2,83% |
| 13 | Gudat, Max ( PIRATEN ) | 7 | 1,04% |
Zweitstimmen nach Wahlvorschlag
| Partei | Zweitstimmen | Prozent | |
|---|---|---|---|
| 1 | CSU | 285 | 42,86% |
| 2 | SPD | 178 | 26,77% |
| 3 | FREIE WÄHLER | 99 | 14,89% |
| 4 | GRÜNE | 35 | 5,26% |
| 5 | FDP | 13 | 1,95% |
| 6 | DIE LINKE | 11 | 1,65% |
| 7 | ÖDP | 3 | 0,45% |
| 8 | REP | 6 | 0,90% |
| 9 | NPD | 5 | 0,75% |
| 10 | BP | 5 | 0,75% |
| 11 | FRAUENLISTE | 4 | 0,60% |
| 12 | DIE FRANKEN | 15 | 2,26% |
| 13 | PIRATEN | 6 | 0,90% |
- Stand: 22.09.2013 16:55:13