OK.Wahl
Internetpräsentation
Version 2.2.7
Ergebnis zur Bezirkswahl 2013 am 15.09.2013
Stimmkreis Bayreuth - Landkreis Landkreis Bayreuth - Gemeinde Mistelgau
Es wurden alle Stimmbezirke ausgewertet.
 Diagramm
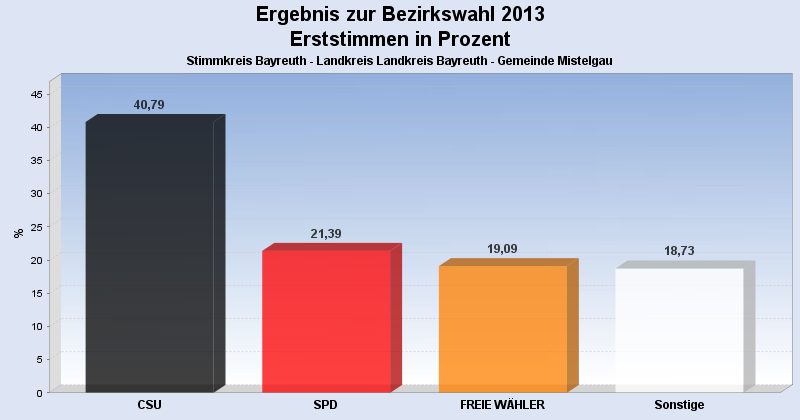
 Seitenanfang
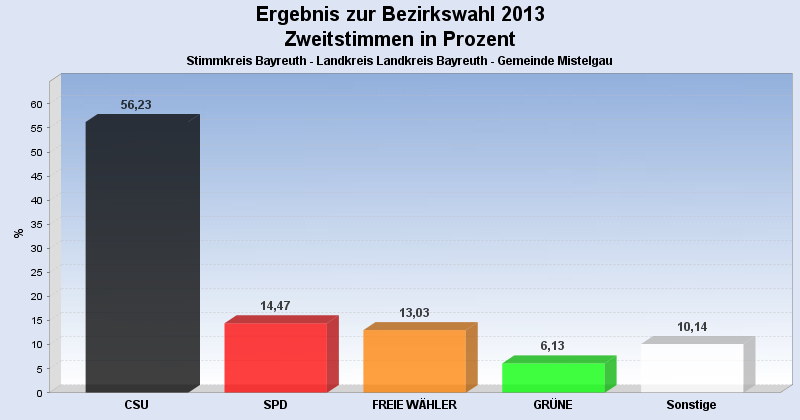
Wahlbeteiligung, Stimmzettel, Stimmen
| Wahlbeteiligung: | 66,61% |
|---|---|
| Stimmberechtigte: | 2.971 |
| Wähler: | 1.979 |
| Ungültige Erststimmen: | 20 |
| Gültige Erststimmen: | 1.959 |
| Ungültige Zweitstimmen: | 37 |
| Gültige Zweitstimmen: | 1.942 |
Erststimmen nach Wahlvorschlag
| Partei | Erststimmen | Prozent | |
|---|---|---|---|
| 1 | Dr. Specht, Stefan ( CSU ) | 799 | 40,79% |
| 2 | Dr. Kuhn, Beate ( SPD ) | 419 | 21,39% |
| 3 | Frühbeißer, Stefan ( FREIE WÄHLER ) | 374 | 19,09% |
| 4 | Pargent, Tim ( GRÜNE ) | 95 | 4,85% |
| 5 | Dr. Schweingel, Dieter ( FDP ) | 55 | 2,81% |
| 6 | Böhner, Georg ( DIE LINKE ) | 36 | 1,84% |
| 7 | Zimmermann, Konrad ( ÖDP ) | 14 | 0,71% |
| 8 | Prechtl, Hermann ( REP ) | 17 | 0,87% |
| 9 | Blankenburg, Moroni ( NPD ) | 17 | 0,87% |
| 10 | Schneider, Jürgen ( BP ) | 5 | 0,26% |
| 12 | Dressendörfer, Horst ( DIE FRANKEN ) | 93 | 4,75% |
| 13 | Gudat, Max ( PIRATEN ) | 35 | 1,79% |
Zweitstimmen nach Wahlvorschlag
| Partei | Zweitstimmen | Prozent | |
|---|---|---|---|
| 1 | CSU | 1.092 | 56,23% |
| 2 | SPD | 281 | 14,47% |
| 3 | FREIE WÄHLER | 253 | 13,03% |
| 4 | GRÜNE | 119 | 6,13% |
| 5 | FDP | 28 | 1,44% |
| 6 | DIE LINKE | 26 | 1,34% |
| 7 | ÖDP | 11 | 0,57% |
| 8 | REP | 16 | 0,82% |
| 9 | NPD | 15 | 0,77% |
| 10 | BP | 9 | 0,46% |
| 11 | FRAUENLISTE | 10 | 0,51% |
| 12 | DIE FRANKEN | 52 | 2,68% |
| 13 | PIRATEN | 30 | 1,54% |
- Stand: 22.09.2013 16:54:58