OK.Wahl
Internetpräsentation
Version 2.2.7
Ergebnis zur Bezirkswahl 2013 am 15.09.2013
Stimmkreis Bayreuth - Landkreis Landkreis Bayreuth - Gemeinde Hummeltal
Es wurden alle Stimmbezirke ausgewertet.
 Diagramm
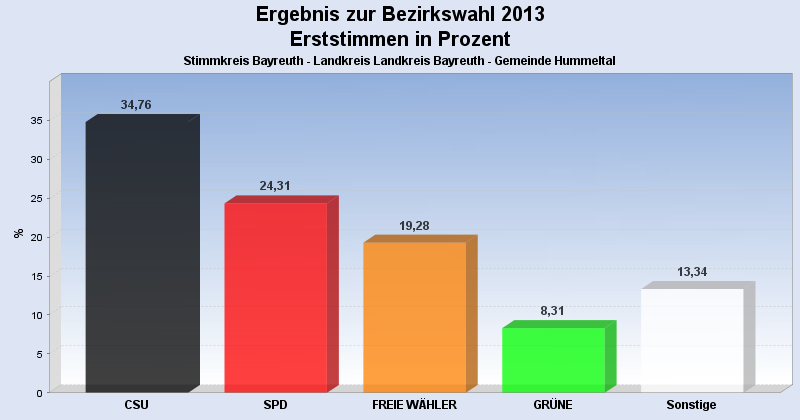
 Seitenanfang
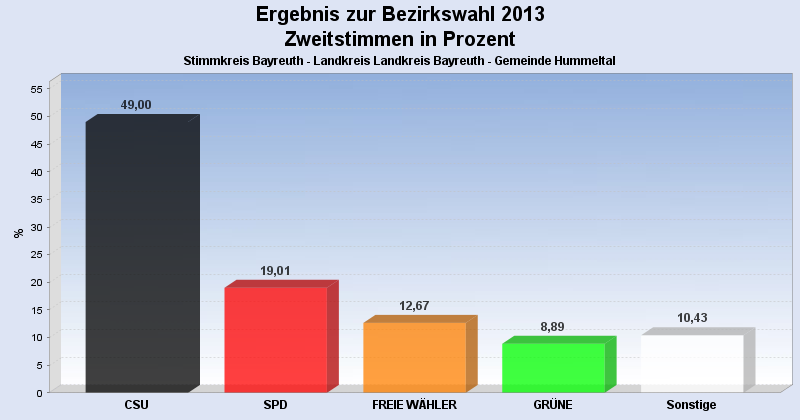
Wahlbeteiligung, Stimmzettel, Stimmen
| Wahlbeteiligung: | 67,57% |
|---|---|
| Stimmberechtigte: | 1.964 |
| Wähler: | 1.327 |
| Ungültige Erststimmen: | 15 |
| Gültige Erststimmen: | 1.312 |
| Ungültige Zweitstimmen: | 33 |
| Gültige Zweitstimmen: | 1.294 |
Erststimmen nach Wahlvorschlag
| Partei | Erststimmen | Prozent | |
|---|---|---|---|
| 1 | Dr. Specht, Stefan ( CSU ) | 456 | 34,76% |
| 2 | Dr. Kuhn, Beate ( SPD ) | 319 | 24,31% |
| 3 | Frühbeißer, Stefan ( FREIE WÄHLER ) | 253 | 19,28% |
| 4 | Pargent, Tim ( GRÜNE ) | 109 | 8,31% |
| 5 | Dr. Schweingel, Dieter ( FDP ) | 44 | 3,35% |
| 6 | Böhner, Georg ( DIE LINKE ) | 11 | 0,84% |
| 7 | Zimmermann, Konrad ( ÖDP ) | 18 | 1,37% |
| 8 | Prechtl, Hermann ( REP ) | 13 | 0,99% |
| 9 | Blankenburg, Moroni ( NPD ) | 11 | 0,84% |
| 10 | Schneider, Jürgen ( BP ) | 7 | 0,53% |
| 12 | Dressendörfer, Horst ( DIE FRANKEN ) | 47 | 3,58% |
| 13 | Gudat, Max ( PIRATEN ) | 24 | 1,83% |
Zweitstimmen nach Wahlvorschlag
| Partei | Zweitstimmen | Prozent | |
|---|---|---|---|
| 1 | CSU | 634 | 49,00% |
| 2 | SPD | 246 | 19,01% |
| 3 | FREIE WÄHLER | 164 | 12,67% |
| 4 | GRÜNE | 115 | 8,89% |
| 5 | FDP | 26 | 2,01% |
| 6 | DIE LINKE | 14 | 1,08% |
| 7 | ÖDP | 13 | 1,00% |
| 8 | REP | 12 | 0,93% |
| 9 | NPD | 10 | 0,77% |
| 10 | BP | 4 | 0,31% |
| 11 | FRAUENLISTE | 8 | 0,62% |
| 12 | DIE FRANKEN | 31 | 2,40% |
| 13 | PIRATEN | 17 | 1,31% |
- Stand: 22.09.2013 16:54:55