OK.Wahl
Internetpräsentation
Version 2.2.7
Ergebnis zur Bezirkswahl 2013 am 15.09.2013
Stimmkreis Bayreuth - Landkreis Landkreis Bayreuth - Gemeinde Heinersreuth
Es wurden alle Stimmbezirke ausgewertet.
 Diagramm
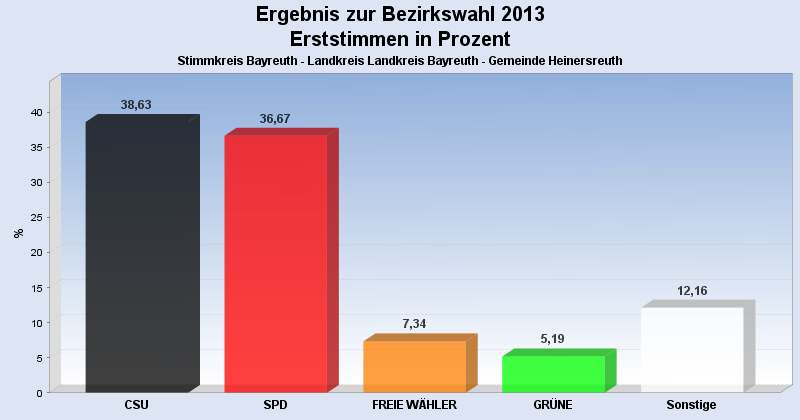
 Seitenanfang
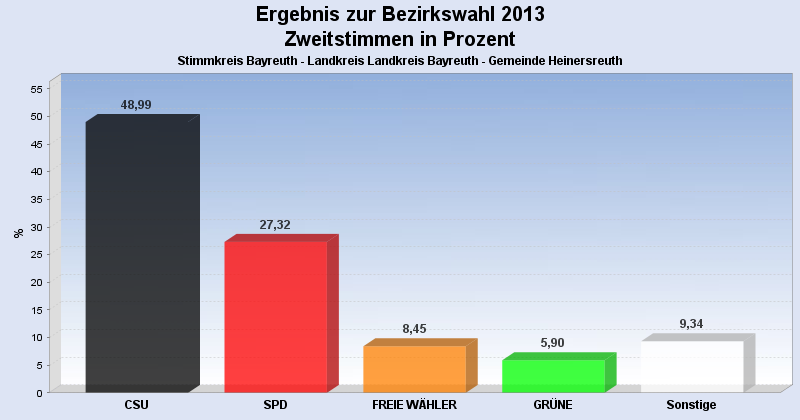
Wahlbeteiligung, Stimmzettel, Stimmen
| Wahlbeteiligung: | 70,28% |
|---|---|
| Stimmberechtigte: | 3.075 |
| Wähler: | 2.161 |
| Ungültige Erststimmen: | 23 |
| Gültige Erststimmen: | 2.138 |
| Ungültige Zweitstimmen: | 42 |
| Gültige Zweitstimmen: | 2.119 |
Erststimmen nach Wahlvorschlag
| Partei | Erststimmen | Prozent | |
|---|---|---|---|
| 1 | Dr. Specht, Stefan ( CSU ) | 826 | 38,63% |
| 2 | Dr. Kuhn, Beate ( SPD ) | 784 | 36,67% |
| 3 | Frühbeißer, Stefan ( FREIE WÄHLER ) | 157 | 7,34% |
| 4 | Pargent, Tim ( GRÜNE ) | 111 | 5,19% |
| 5 | Dr. Schweingel, Dieter ( FDP ) | 74 | 3,46% |
| 6 | Böhner, Georg ( DIE LINKE ) | 31 | 1,45% |
| 7 | Zimmermann, Konrad ( ÖDP ) | 13 | 0,61% |
| 8 | Prechtl, Hermann ( REP ) | 11 | 0,51% |
| 9 | Blankenburg, Moroni ( NPD ) | 18 | 0,84% |
| 10 | Schneider, Jürgen ( BP ) | 6 | 0,28% |
| 12 | Dressendörfer, Horst ( DIE FRANKEN ) | 74 | 3,46% |
| 13 | Gudat, Max ( PIRATEN ) | 33 | 1,54% |
Zweitstimmen nach Wahlvorschlag
| Partei | Zweitstimmen | Prozent | |
|---|---|---|---|
| 1 | CSU | 1.038 | 48,99% |
| 2 | SPD | 579 | 27,32% |
| 3 | FREIE WÄHLER | 179 | 8,45% |
| 4 | GRÜNE | 125 | 5,90% |
| 5 | FDP | 41 | 1,93% |
| 6 | DIE LINKE | 32 | 1,51% |
| 7 | ÖDP | 8 | 0,38% |
| 8 | REP | 16 | 0,76% |
| 9 | NPD | 16 | 0,76% |
| 10 | BP | 9 | 0,42% |
| 11 | FRAUENLISTE | 4 | 0,19% |
| 12 | DIE FRANKEN | 46 | 2,17% |
| 13 | PIRATEN | 26 | 1,23% |
- Stand: 22.09.2013 16:54:47