OK.Wahl
Internetpräsentation
Version 2.2.7
Ergebnis zur Bezirkswahl 2013 am 15.09.2013
Stimmkreis Bayreuth - Landkreis Landkreis Bayreuth - Gemeinde Haag
Es wurden alle Stimmbezirke ausgewertet.
 Diagramm
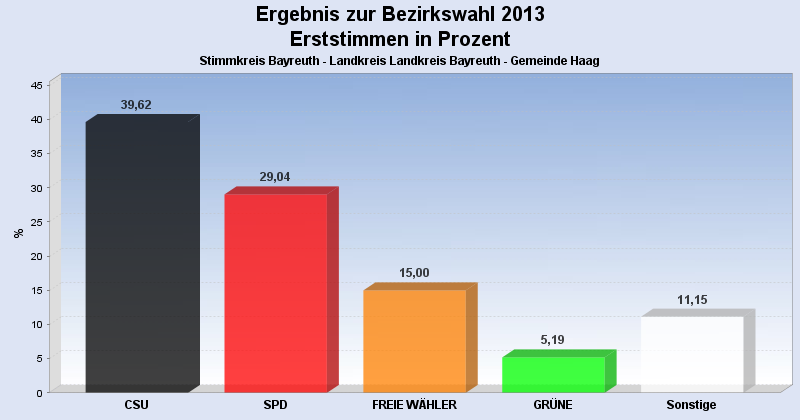
 Seitenanfang
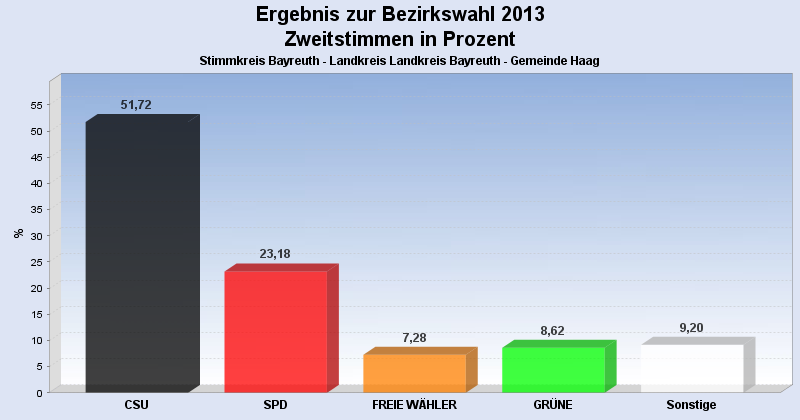
Wahlbeteiligung, Stimmzettel, Stimmen
| Wahlbeteiligung: | 69,66% |
|---|---|
| Stimmberechtigte: | 758 |
| Wähler: | 528 |
| Ungültige Erststimmen: | 8 |
| Gültige Erststimmen: | 520 |
| Ungültige Zweitstimmen: | 6 |
| Gültige Zweitstimmen: | 522 |
Erststimmen nach Wahlvorschlag
| Partei | Erststimmen | Prozent | |
|---|---|---|---|
| 1 | Dr. Specht, Stefan ( CSU ) | 206 | 39,62% |
| 2 | Dr. Kuhn, Beate ( SPD ) | 151 | 29,04% |
| 3 | Frühbeißer, Stefan ( FREIE WÄHLER ) | 78 | 15,00% |
| 4 | Pargent, Tim ( GRÜNE ) | 27 | 5,19% |
| 5 | Dr. Schweingel, Dieter ( FDP ) | 8 | 1,54% |
| 6 | Böhner, Georg ( DIE LINKE ) | 12 | 2,31% |
| 7 | Zimmermann, Konrad ( ÖDP ) | 6 | 1,15% |
| 8 | Prechtl, Hermann ( REP ) | 2 | 0,38% |
| 9 | Blankenburg, Moroni ( NPD ) | 5 | 0,96% |
| 10 | Schneider, Jürgen ( BP ) | 0 | 0,00% |
| 12 | Dressendörfer, Horst ( DIE FRANKEN ) | 22 | 4,23% |
| 13 | Gudat, Max ( PIRATEN ) | 3 | 0,58% |
Zweitstimmen nach Wahlvorschlag
| Partei | Zweitstimmen | Prozent | |
|---|---|---|---|
| 1 | CSU | 270 | 51,72% |
| 2 | SPD | 121 | 23,18% |
| 3 | FREIE WÄHLER | 38 | 7,28% |
| 4 | GRÜNE | 45 | 8,62% |
| 5 | FDP | 8 | 1,53% |
| 6 | DIE LINKE | 9 | 1,72% |
| 7 | ÖDP | 5 | 0,96% |
| 8 | REP | 3 | 0,57% |
| 9 | NPD | 5 | 0,96% |
| 10 | BP | 0 | 0,00% |
| 11 | FRAUENLISTE | 1 | 0,19% |
| 12 | DIE FRANKEN | 13 | 2,49% |
| 13 | PIRATEN | 4 | 0,77% |
- Stand: 22.09.2013 16:54:45