OK.Wahl
Internetpräsentation
Version 2.2.7
Ergebnis zur Bezirkswahl 2013 am 15.09.2013
Stimmkreis Bayreuth - Landkreis Landkreis Bayreuth - Stadt Goldkronach
Es wurden alle Stimmbezirke ausgewertet.
 Diagramm
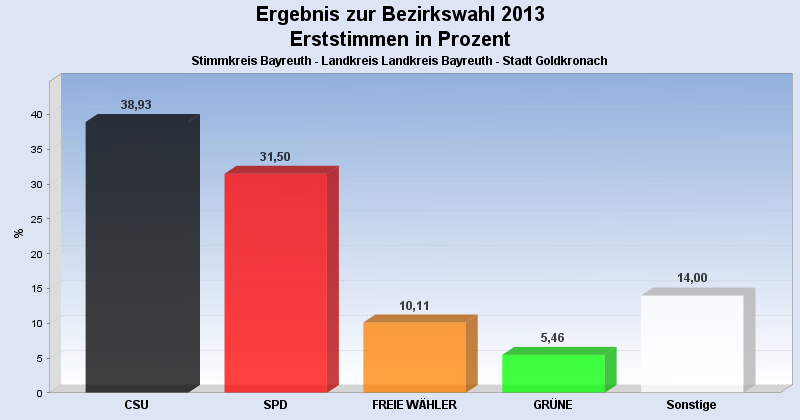
 Seitenanfang
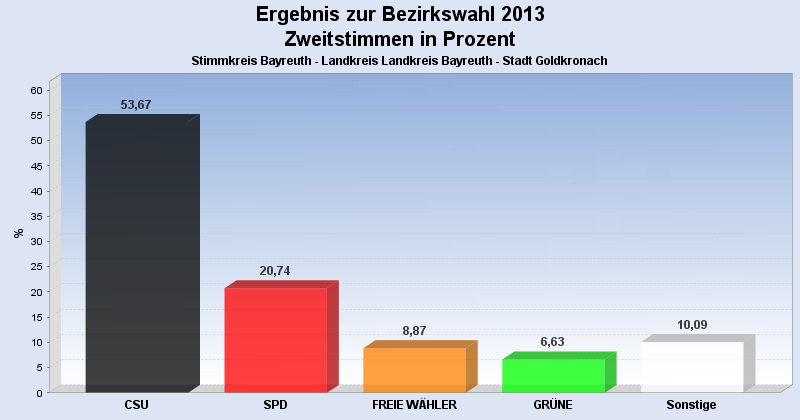
Wahlbeteiligung, Stimmzettel, Stimmen
| Wahlbeteiligung: | 67,07% |
|---|---|
| Stimmberechtigte: | 2.976 |
| Wähler: | 1.996 |
| Ungültige Erststimmen: | 18 |
| Gültige Erststimmen: | 1.978 |
| Ungültige Zweitstimmen: | 34 |
| Gültige Zweitstimmen: | 1.962 |
Erststimmen nach Wahlvorschlag
| Partei | Erststimmen | Prozent | |
|---|---|---|---|
| 1 | Dr. Specht, Stefan ( CSU ) | 770 | 38,93% |
| 2 | Dr. Kuhn, Beate ( SPD ) | 623 | 31,50% |
| 3 | Frühbeißer, Stefan ( FREIE WÄHLER ) | 200 | 10,11% |
| 4 | Pargent, Tim ( GRÜNE ) | 108 | 5,46% |
| 5 | Dr. Schweingel, Dieter ( FDP ) | 70 | 3,54% |
| 6 | Böhner, Georg ( DIE LINKE ) | 27 | 1,37% |
| 7 | Zimmermann, Konrad ( ÖDP ) | 20 | 1,01% |
| 8 | Prechtl, Hermann ( REP ) | 14 | 0,71% |
| 9 | Blankenburg, Moroni ( NPD ) | 20 | 1,01% |
| 10 | Schneider, Jürgen ( BP ) | 8 | 0,40% |
| 12 | Dressendörfer, Horst ( DIE FRANKEN ) | 86 | 4,35% |
| 13 | Gudat, Max ( PIRATEN ) | 32 | 1,62% |
Zweitstimmen nach Wahlvorschlag
| Partei | Zweitstimmen | Prozent | |
|---|---|---|---|
| 1 | CSU | 1.053 | 53,67% |
| 2 | SPD | 407 | 20,74% |
| 3 | FREIE WÄHLER | 174 | 8,87% |
| 4 | GRÜNE | 130 | 6,63% |
| 5 | FDP | 32 | 1,63% |
| 6 | DIE LINKE | 29 | 1,48% |
| 7 | ÖDP | 14 | 0,71% |
| 8 | REP | 19 | 0,97% |
| 9 | NPD | 19 | 0,97% |
| 10 | BP | 5 | 0,25% |
| 11 | FRAUENLISTE | 10 | 0,51% |
| 12 | DIE FRANKEN | 46 | 2,34% |
| 13 | PIRATEN | 24 | 1,22% |
- Stand: 22.09.2013 16:54:42