OK.Wahl
Internetpräsentation
Version 2.2.7
Ergebnis zur Bezirkswahl 2013 am 15.09.2013
Stimmkreis Bayreuth - Landkreis Landkreis Bayreuth - Gemeinde Glashütten
Es wurden alle Stimmbezirke ausgewertet.
 Diagramm
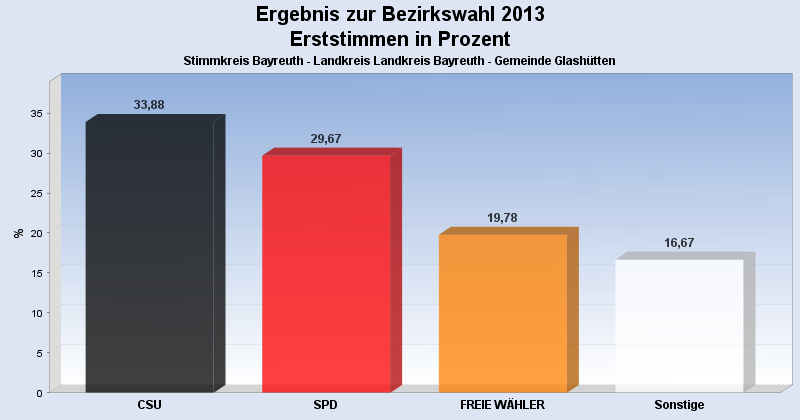
 Seitenanfang
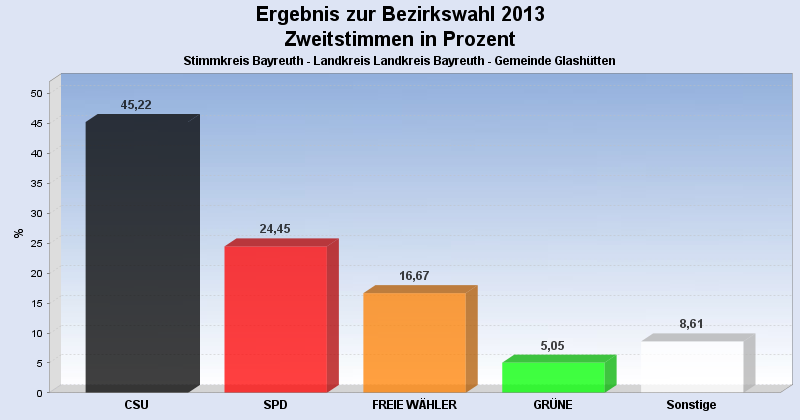
Wahlbeteiligung, Stimmzettel, Stimmen
| Wahlbeteiligung: | 64,40% |
|---|---|
| Stimmberechtigte: | 1.163 |
| Wähler: | 749 |
| Ungültige Erststimmen: | 11 |
| Gültige Erststimmen: | 738 |
| Ungültige Zweitstimmen: | 17 |
| Gültige Zweitstimmen: | 732 |
Erststimmen nach Wahlvorschlag
| Partei | Erststimmen | Prozent | |
|---|---|---|---|
| 1 | Dr. Specht, Stefan ( CSU ) | 250 | 33,88% |
| 2 | Dr. Kuhn, Beate ( SPD ) | 219 | 29,67% |
| 3 | Frühbeißer, Stefan ( FREIE WÄHLER ) | 146 | 19,78% |
| 4 | Pargent, Tim ( GRÜNE ) | 35 | 4,74% |
| 5 | Dr. Schweingel, Dieter ( FDP ) | 20 | 2,71% |
| 6 | Böhner, Georg ( DIE LINKE ) | 10 | 1,36% |
| 7 | Zimmermann, Konrad ( ÖDP ) | 14 | 1,90% |
| 8 | Prechtl, Hermann ( REP ) | 4 | 0,54% |
| 9 | Blankenburg, Moroni ( NPD ) | 1 | 0,14% |
| 10 | Schneider, Jürgen ( BP ) | 3 | 0,41% |
| 12 | Dressendörfer, Horst ( DIE FRANKEN ) | 27 | 3,66% |
| 13 | Gudat, Max ( PIRATEN ) | 9 | 1,22% |
Zweitstimmen nach Wahlvorschlag
| Partei | Zweitstimmen | Prozent | |
|---|---|---|---|
| 1 | CSU | 331 | 45,22% |
| 2 | SPD | 179 | 24,45% |
| 3 | FREIE WÄHLER | 122 | 16,67% |
| 4 | GRÜNE | 37 | 5,05% |
| 5 | FDP | 7 | 0,96% |
| 6 | DIE LINKE | 10 | 1,37% |
| 7 | ÖDP | 13 | 1,78% |
| 8 | REP | 3 | 0,41% |
| 9 | NPD | 2 | 0,27% |
| 10 | BP | 3 | 0,41% |
| 11 | FRAUENLISTE | 2 | 0,27% |
| 12 | DIE FRANKEN | 13 | 1,78% |
| 13 | PIRATEN | 10 | 1,37% |
- Stand: 22.09.2013 16:54:41