OK.Wahl
Internetpräsentation
Version 2.2.7
Ergebnis zur Bezirkswahl 2013 am 15.09.2013
Stimmkreis Bayreuth - Landkreis Landkreis Bayreuth - Gemeinde Gesees
Es wurden alle Stimmbezirke ausgewertet.
 Diagramm
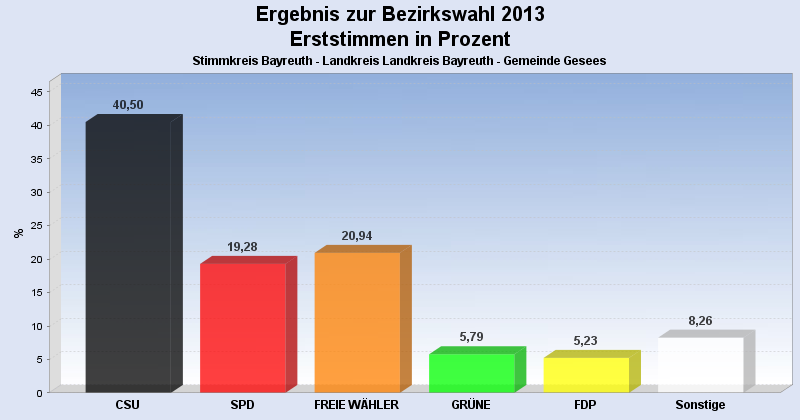
 Seitenanfang
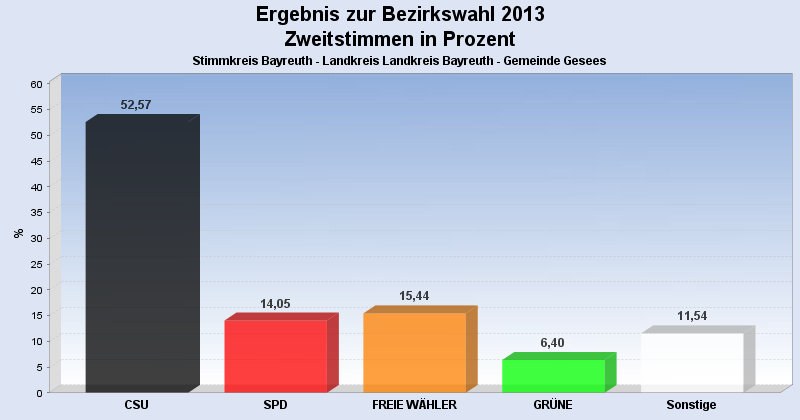
Wahlbeteiligung, Stimmzettel, Stimmen
| Wahlbeteiligung: | 69,57% |
|---|---|
| Stimmberechtigte: | 1.058 |
| Wähler: | 736 |
| Ungültige Erststimmen: | 10 |
| Gültige Erststimmen: | 726 |
| Ungültige Zweitstimmen: | 17 |
| Gültige Zweitstimmen: | 719 |
Erststimmen nach Wahlvorschlag
| Partei | Erststimmen | Prozent | |
|---|---|---|---|
| 1 | Dr. Specht, Stefan ( CSU ) | 294 | 40,50% |
| 2 | Dr. Kuhn, Beate ( SPD ) | 140 | 19,28% |
| 3 | Frühbeißer, Stefan ( FREIE WÄHLER ) | 152 | 20,94% |
| 4 | Pargent, Tim ( GRÜNE ) | 42 | 5,79% |
| 5 | Dr. Schweingel, Dieter ( FDP ) | 38 | 5,23% |
| 6 | Böhner, Georg ( DIE LINKE ) | 5 | 0,69% |
| 7 | Zimmermann, Konrad ( ÖDP ) | 7 | 0,96% |
| 8 | Prechtl, Hermann ( REP ) | 5 | 0,69% |
| 9 | Blankenburg, Moroni ( NPD ) | 3 | 0,41% |
| 10 | Schneider, Jürgen ( BP ) | 0 | 0,00% |
| 12 | Dressendörfer, Horst ( DIE FRANKEN ) | 31 | 4,27% |
| 13 | Gudat, Max ( PIRATEN ) | 9 | 1,24% |
Zweitstimmen nach Wahlvorschlag
| Partei | Zweitstimmen | Prozent | |
|---|---|---|---|
| 1 | CSU | 378 | 52,57% |
| 2 | SPD | 101 | 14,05% |
| 3 | FREIE WÄHLER | 111 | 15,44% |
| 4 | GRÜNE | 46 | 6,40% |
| 5 | FDP | 22 | 3,06% |
| 6 | DIE LINKE | 3 | 0,42% |
| 7 | ÖDP | 6 | 0,83% |
| 8 | REP | 10 | 1,39% |
| 9 | NPD | 5 | 0,70% |
| 10 | BP | 5 | 0,70% |
| 11 | FRAUENLISTE | 6 | 0,83% |
| 12 | DIE FRANKEN | 17 | 2,36% |
| 13 | PIRATEN | 9 | 1,25% |
- Stand: 22.09.2013 16:54:40