OK.Wahl
Internetpräsentation
Version 2.2.7
Ergebnis zur Bezirkswahl 2013 am 15.09.2013
Stimmkreis Bayreuth - Landkreis Landkreis Bayreuth - Gemeinde Emtmannsberg
Es wurden alle Stimmbezirke ausgewertet.
 Diagramm
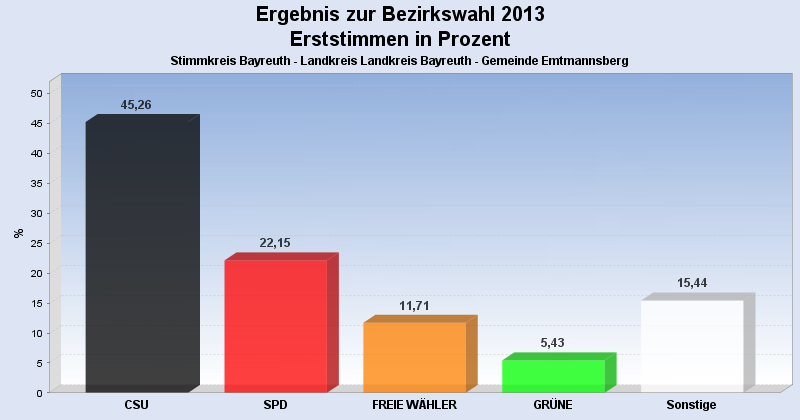
 Seitenanfang
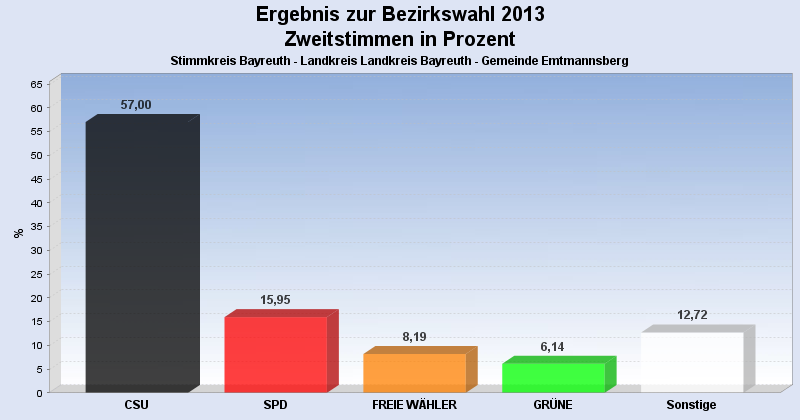
Wahlbeteiligung, Stimmzettel, Stimmen
| Wahlbeteiligung: | 111,09% |
|---|---|
| Stimmberechtigte: | 857 |
| Wähler: | 952 |
| Ungültige Erststimmen: | 13 |
| Gültige Erststimmen: | 939 |
| Ungültige Zweitstimmen: | 24 |
| Gültige Zweitstimmen: | 928 |
Erststimmen nach Wahlvorschlag
| Partei | Erststimmen | Prozent | |
|---|---|---|---|
| 1 | Dr. Specht, Stefan ( CSU ) | 425 | 45,26% |
| 2 | Dr. Kuhn, Beate ( SPD ) | 208 | 22,15% |
| 3 | Frühbeißer, Stefan ( FREIE WÄHLER ) | 110 | 11,71% |
| 4 | Pargent, Tim ( GRÜNE ) | 51 | 5,43% |
| 5 | Dr. Schweingel, Dieter ( FDP ) | 35 | 3,73% |
| 6 | Böhner, Georg ( DIE LINKE ) | 14 | 1,49% |
| 7 | Zimmermann, Konrad ( ÖDP ) | 11 | 1,17% |
| 8 | Prechtl, Hermann ( REP ) | 13 | 1,38% |
| 9 | Blankenburg, Moroni ( NPD ) | 8 | 0,85% |
| 10 | Schneider, Jürgen ( BP ) | 5 | 0,53% |
| 12 | Dressendörfer, Horst ( DIE FRANKEN ) | 45 | 4,79% |
| 13 | Gudat, Max ( PIRATEN ) | 14 | 1,49% |
Zweitstimmen nach Wahlvorschlag
| Partei | Zweitstimmen | Prozent | |
|---|---|---|---|
| 1 | CSU | 529 | 57,00% |
| 2 | SPD | 148 | 15,95% |
| 3 | FREIE WÄHLER | 76 | 8,19% |
| 4 | GRÜNE | 57 | 6,14% |
| 5 | FDP | 25 | 2,69% |
| 6 | DIE LINKE | 15 | 1,62% |
| 7 | ÖDP | 11 | 1,19% |
| 8 | REP | 15 | 1,62% |
| 9 | NPD | 9 | 0,97% |
| 10 | BP | 4 | 0,43% |
| 11 | FRAUENLISTE | 3 | 0,32% |
| 12 | DIE FRANKEN | 19 | 2,05% |
| 13 | PIRATEN | 17 | 1,83% |
- Stand: 22.09.2013 16:54:38