OK.Wahl
Internetpräsentation
Version 2.2.7
Ergebnis zur Bezirkswahl 2013 am 15.09.2013
Stimmkreis Bayreuth - Landkreis Landkreis Bayreuth - Gemeinde Eckersdorf
Es wurden alle Stimmbezirke ausgewertet.
 Diagramm
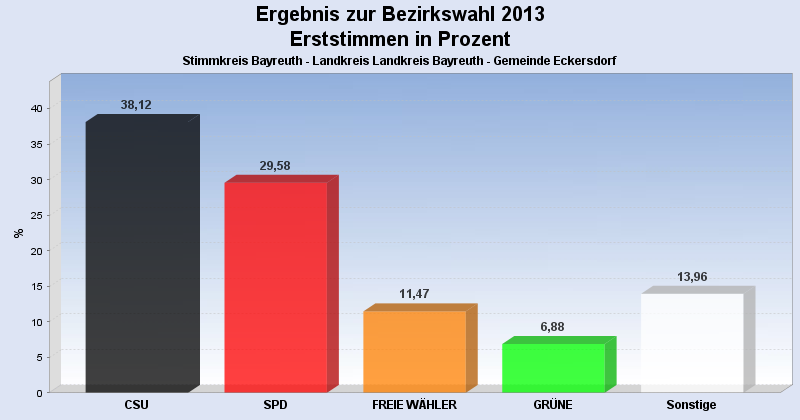
 Seitenanfang
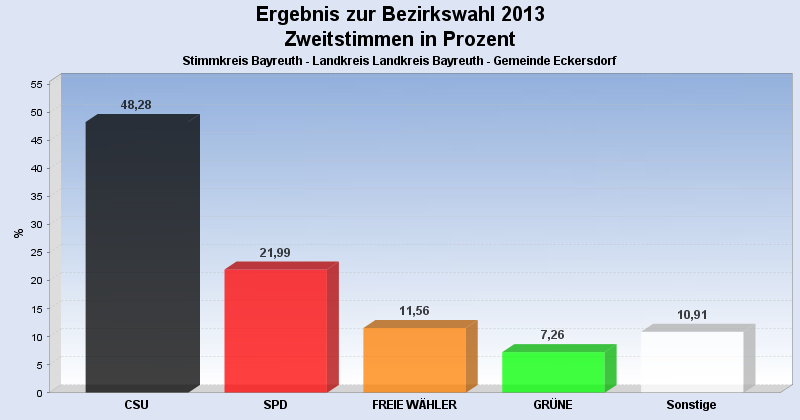
Wahlbeteiligung, Stimmzettel, Stimmen
| Wahlbeteiligung: | 70,04% |
|---|---|
| Stimmberechtigte: | 4.242 |
| Wähler: | 2.971 |
| Ungültige Erststimmen: | 33 |
| Gültige Erststimmen: | 2.938 |
| Ungültige Zweitstimmen: | 65 |
| Gültige Zweitstimmen: | 2.906 |
Erststimmen nach Wahlvorschlag
| Partei | Erststimmen | Prozent | |
|---|---|---|---|
| 1 | Dr. Specht, Stefan ( CSU ) | 1.120 | 38,12% |
| 2 | Dr. Kuhn, Beate ( SPD ) | 869 | 29,58% |
| 3 | Frühbeißer, Stefan ( FREIE WÄHLER ) | 337 | 11,47% |
| 4 | Pargent, Tim ( GRÜNE ) | 202 | 6,88% |
| 5 | Dr. Schweingel, Dieter ( FDP ) | 106 | 3,61% |
| 6 | Böhner, Georg ( DIE LINKE ) | 38 | 1,29% |
| 7 | Zimmermann, Konrad ( ÖDP ) | 49 | 1,67% |
| 8 | Prechtl, Hermann ( REP ) | 23 | 0,78% |
| 9 | Blankenburg, Moroni ( NPD ) | 25 | 0,85% |
| 10 | Schneider, Jürgen ( BP ) | 11 | 0,37% |
| 12 | Dressendörfer, Horst ( DIE FRANKEN ) | 115 | 3,91% |
| 13 | Gudat, Max ( PIRATEN ) | 43 | 1,46% |
Zweitstimmen nach Wahlvorschlag
| Partei | Zweitstimmen | Prozent | |
|---|---|---|---|
| 1 | CSU | 1.403 | 48,28% |
| 2 | SPD | 639 | 21,99% |
| 3 | FREIE WÄHLER | 336 | 11,56% |
| 4 | GRÜNE | 211 | 7,26% |
| 5 | FDP | 72 | 2,48% |
| 6 | DIE LINKE | 36 | 1,24% |
| 7 | ÖDP | 29 | 1,00% |
| 8 | REP | 28 | 0,96% |
| 9 | NPD | 28 | 0,96% |
| 10 | BP | 10 | 0,34% |
| 11 | FRAUENLISTE | 9 | 0,31% |
| 12 | DIE FRANKEN | 63 | 2,17% |
| 13 | PIRATEN | 42 | 1,45% |
- Stand: 22.09.2013 16:54:33