OK.Wahl
Internetpräsentation
Version 2.2.7
Ergebnis zur Bezirkswahl 2013 am 15.09.2013
Stimmkreis Bayreuth - Landkreis Landkreis Bayreuth - Stadt Creußen
Es wurden alle Stimmbezirke ausgewertet.
 Diagramm
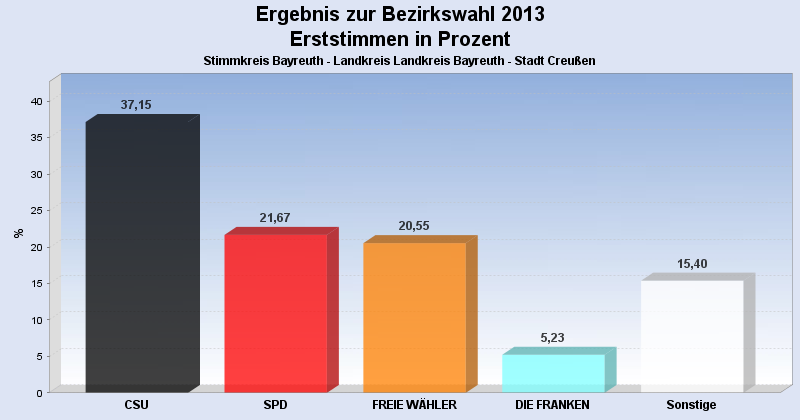
 Seitenanfang
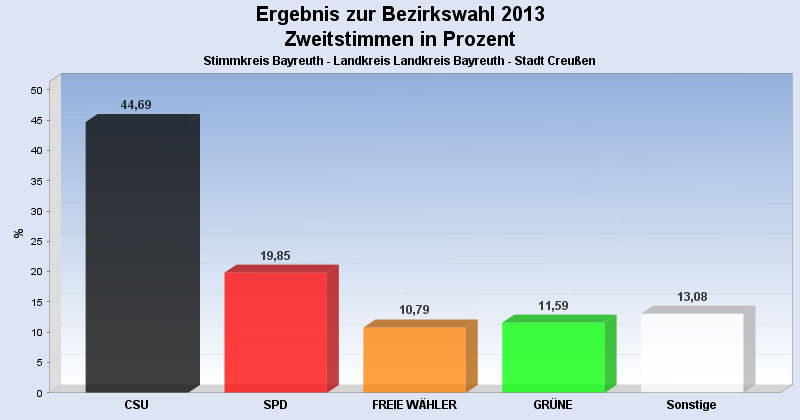
Wahlbeteiligung, Stimmzettel, Stimmen
| Wahlbeteiligung: | 64,01% |
|---|---|
| Stimmberechtigte: | 3.954 |
| Wähler: | 2.531 |
| Ungültige Erststimmen: | 25 |
| Gültige Erststimmen: | 2.506 |
| Ungültige Zweitstimmen: | 46 |
| Gültige Zweitstimmen: | 2.484 |
Erststimmen nach Wahlvorschlag
| Partei | Erststimmen | Prozent | |
|---|---|---|---|
| 1 | Dr. Specht, Stefan ( CSU ) | 931 | 37,15% |
| 2 | Dr. Kuhn, Beate ( SPD ) | 543 | 21,67% |
| 3 | Frühbeißer, Stefan ( FREIE WÄHLER ) | 515 | 20,55% |
| 4 | Pargent, Tim ( GRÜNE ) | 122 | 4,87% |
| 5 | Dr. Schweingel, Dieter ( FDP ) | 80 | 3,19% |
| 6 | Böhner, Georg ( DIE LINKE ) | 46 | 1,84% |
| 7 | Zimmermann, Konrad ( ÖDP ) | 20 | 0,80% |
| 8 | Prechtl, Hermann ( REP ) | 28 | 1,12% |
| 9 | Blankenburg, Moroni ( NPD ) | 38 | 1,52% |
| 10 | Schneider, Jürgen ( BP ) | 9 | 0,36% |
| 12 | Dressendörfer, Horst ( DIE FRANKEN ) | 131 | 5,23% |
| 13 | Gudat, Max ( PIRATEN ) | 43 | 1,72% |
Zweitstimmen nach Wahlvorschlag
| Partei | Zweitstimmen | Prozent | |
|---|---|---|---|
| 1 | CSU | 1.110 | 44,69% |
| 2 | SPD | 493 | 19,85% |
| 3 | FREIE WÄHLER | 268 | 10,79% |
| 4 | GRÜNE | 288 | 11,59% |
| 5 | FDP | 53 | 2,13% |
| 6 | DIE LINKE | 44 | 1,77% |
| 7 | ÖDP | 14 | 0,56% |
| 8 | REP | 37 | 1,49% |
| 9 | NPD | 36 | 1,45% |
| 10 | BP | 17 | 0,68% |
| 11 | FRAUENLISTE | 18 | 0,72% |
| 12 | DIE FRANKEN | 68 | 2,74% |
| 13 | PIRATEN | 38 | 1,53% |
- Stand: 22.09.2013 16:54:29