OK.Wahl
Internetpräsentation
Version 2.2.7
Ergebnis zur Bezirkswahl 2013 am 15.09.2013
Stimmkreis Bayreuth - Landkreis Landkreis Bayreuth - Gemeinde Bindlach
Es wurden alle Stimmbezirke ausgewertet.
 Diagramm
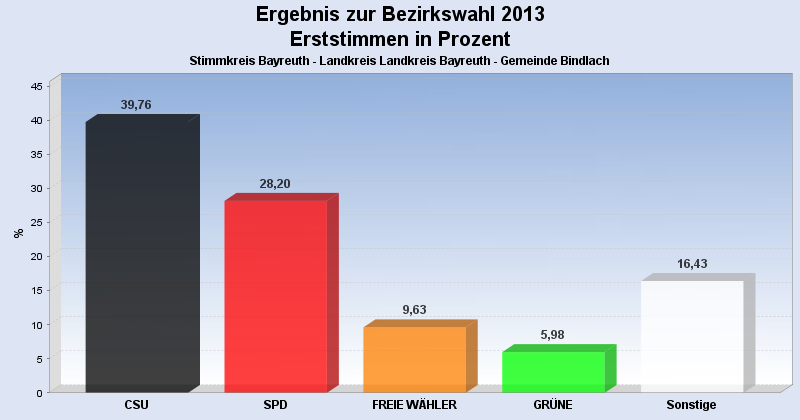
 Seitenanfang
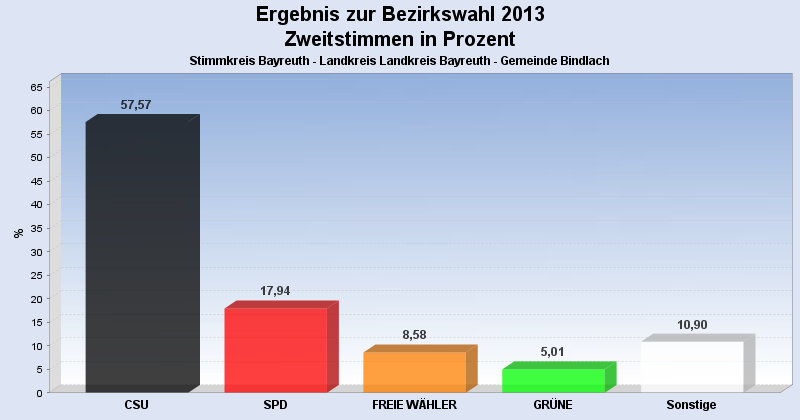
Wahlbeteiligung, Stimmzettel, Stimmen
| Wahlbeteiligung: | 61,34% |
|---|---|
| Stimmberechtigte: | 5.797 |
| Wähler: | 3.556 |
| Ungültige Erststimmen: | 45 |
| Gültige Erststimmen: | 3.511 |
| Ungültige Zweitstimmen: | 61 |
| Gültige Zweitstimmen: | 3.495 |
Erststimmen nach Wahlvorschlag
| Partei | Erststimmen | Prozent | |
|---|---|---|---|
| 1 | Dr. Specht, Stefan ( CSU ) | 1.396 | 39,76% |
| 2 | Dr. Kuhn, Beate ( SPD ) | 990 | 28,20% |
| 3 | Frühbeißer, Stefan ( FREIE WÄHLER ) | 338 | 9,63% |
| 4 | Pargent, Tim ( GRÜNE ) | 210 | 5,98% |
| 5 | Dr. Schweingel, Dieter ( FDP ) | 148 | 4,22% |
| 6 | Böhner, Georg ( DIE LINKE ) | 67 | 1,91% |
| 7 | Zimmermann, Konrad ( ÖDP ) | 40 | 1,14% |
| 8 | Prechtl, Hermann ( REP ) | 37 | 1,05% |
| 9 | Blankenburg, Moroni ( NPD ) | 31 | 0,88% |
| 10 | Schneider, Jürgen ( BP ) | 14 | 0,40% |
| 12 | Dressendörfer, Horst ( DIE FRANKEN ) | 166 | 4,73% |
| 13 | Gudat, Max ( PIRATEN ) | 74 | 2,11% |
Zweitstimmen nach Wahlvorschlag
| Partei | Zweitstimmen | Prozent | |
|---|---|---|---|
| 1 | CSU | 2.012 | 57,57% |
| 2 | SPD | 627 | 17,94% |
| 3 | FREIE WÄHLER | 300 | 8,58% |
| 4 | GRÜNE | 175 | 5,01% |
| 5 | FDP | 58 | 1,66% |
| 6 | DIE LINKE | 70 | 2,00% |
| 7 | ÖDP | 28 | 0,80% |
| 8 | REP | 41 | 1,17% |
| 9 | NPD | 31 | 0,89% |
| 10 | BP | 10 | 0,29% |
| 11 | FRAUENLISTE | 18 | 0,52% |
| 12 | DIE FRANKEN | 78 | 2,23% |
| 13 | PIRATEN | 47 | 1,34% |
- Stand: 22.09.2013 16:54:25