OK.Wahl
Internetpräsentation
Version 2.2.7
Ergebnis zur Bezirkswahl 2013 am 15.09.2013
Stimmkreis Bayreuth - Landkreis Landkreis Bayreuth - Stadt Betzenstein
Es wurden alle Stimmbezirke ausgewertet.
 Diagramm
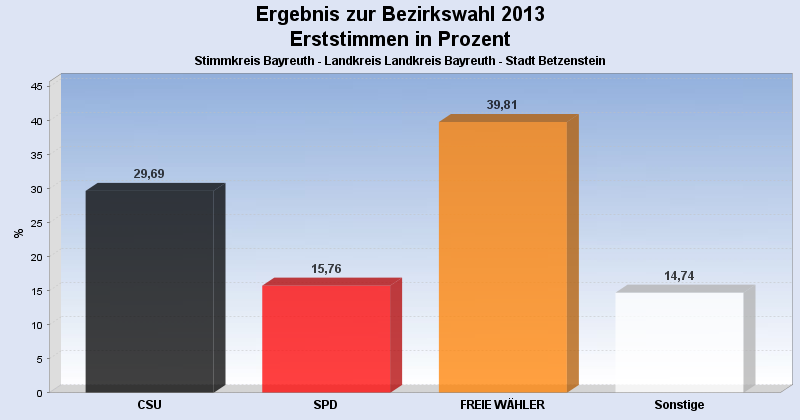
 Seitenanfang
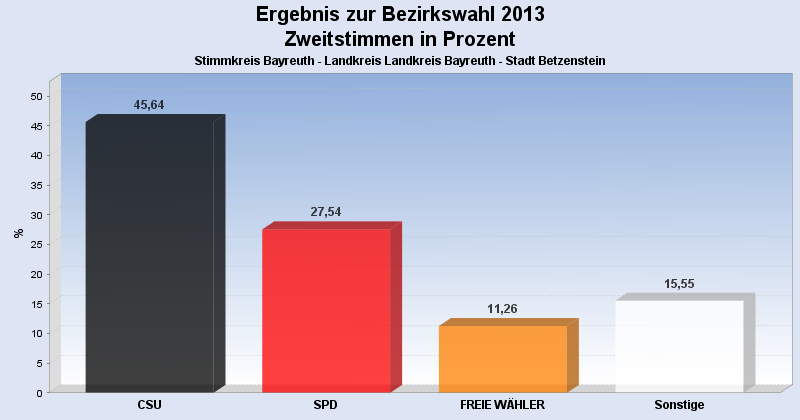
Wahlbeteiligung, Stimmzettel, Stimmen
| Wahlbeteiligung: | 69,34% |
|---|---|
| Stimmberechtigte: | 2.022 |
| Wähler: | 1.402 |
| Ungültige Erststimmen: | 11 |
| Gültige Erststimmen: | 1.364 |
| Ungültige Zweitstimmen: | 26 |
| Gültige Zweitstimmen: | 1.376 |
Erststimmen nach Wahlvorschlag
| Partei | Erststimmen | Prozent | |
|---|---|---|---|
| 1 | Dr. Specht, Stefan ( CSU ) | 405 | 29,69% |
| 2 | Dr. Kuhn, Beate ( SPD ) | 215 | 15,76% |
| 3 | Frühbeißer, Stefan ( FREIE WÄHLER ) | 543 | 39,81% |
| 4 | Pargent, Tim ( GRÜNE ) | 57 | 4,18% |
| 5 | Dr. Schweingel, Dieter ( FDP ) | 20 | 1,47% |
| 6 | Böhner, Georg ( DIE LINKE ) | 20 | 1,47% |
| 7 | Zimmermann, Konrad ( ÖDP ) | 3 | 0,22% |
| 8 | Prechtl, Hermann ( REP ) | 15 | 1,10% |
| 9 | Blankenburg, Moroni ( NPD ) | 11 | 0,81% |
| 10 | Schneider, Jürgen ( BP ) | 11 | 0,81% |
| 12 | Dressendörfer, Horst ( DIE FRANKEN ) | 39 | 2,86% |
| 13 | Gudat, Max ( PIRATEN ) | 25 | 1,83% |
Zweitstimmen nach Wahlvorschlag
| Partei | Zweitstimmen | Prozent | |
|---|---|---|---|
| 1 | CSU | 628 | 45,64% |
| 2 | SPD | 379 | 27,54% |
| 3 | FREIE WÄHLER | 155 | 11,26% |
| 4 | GRÜNE | 66 | 4,80% |
| 5 | FDP | 12 | 0,87% |
| 6 | DIE LINKE | 19 | 1,38% |
| 7 | ÖDP | 2 | 0,15% |
| 8 | REP | 20 | 1,45% |
| 9 | NPD | 9 | 0,65% |
| 10 | BP | 27 | 1,96% |
| 11 | FRAUENLISTE | 5 | 0,36% |
| 12 | DIE FRANKEN | 35 | 2,54% |
| 13 | PIRATEN | 19 | 1,38% |
- Stand: 22.09.2013 16:54:22