OK.Wahl
Internetpräsentation
Version 2.2.7
Ergebnis zur Bezirkswahl 2013 am 15.09.2013
Stimmkreis Bayreuth - Landkreis Landkreis Bayreuth - Gemeinde Ahorntal
Es wurden alle Stimmbezirke ausgewertet.
 Diagramm
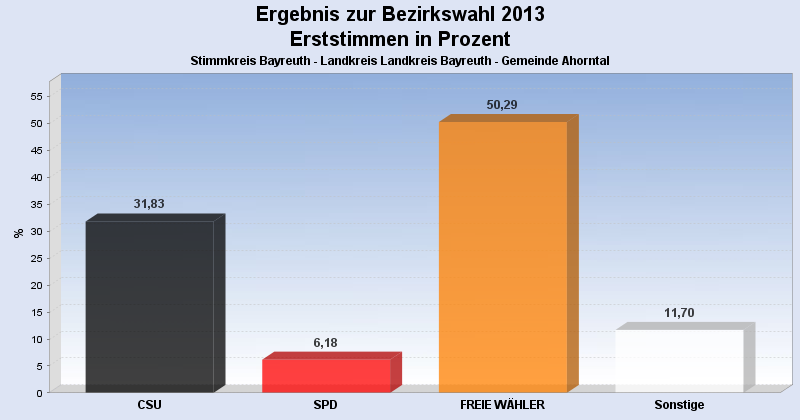
 Seitenanfang
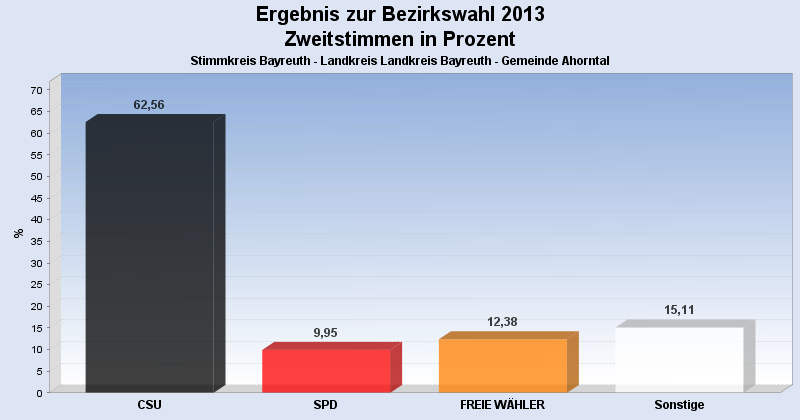
Wahlbeteiligung, Stimmzettel, Stimmen
| Wahlbeteiligung: | 78,05% |
|---|---|
| Stimmberechtigte: | 1.777 |
| Wähler: | 1.387 |
| Ungültige Erststimmen: | 11 |
| Gültige Erststimmen: | 1.376 |
| Ungültige Zweitstimmen: | 30 |
| Gültige Zweitstimmen: | 1.357 |
Erststimmen nach Wahlvorschlag
| Partei | Erststimmen | Prozent | |
|---|---|---|---|
| 1 | Dr. Specht, Stefan ( CSU ) | 438 | 31,83% |
| 2 | Dr. Kuhn, Beate ( SPD ) | 85 | 6,18% |
| 3 | Frühbeißer, Stefan ( FREIE WÄHLER ) | 692 | 50,29% |
| 4 | Pargent, Tim ( GRÜNE ) | 40 | 2,91% |
| 5 | Dr. Schweingel, Dieter ( FDP ) | 14 | 1,02% |
| 6 | Böhner, Georg ( DIE LINKE ) | 4 | 0,29% |
| 7 | Zimmermann, Konrad ( ÖDP ) | 8 | 0,58% |
| 8 | Prechtl, Hermann ( REP ) | 17 | 1,24% |
| 9 | Blankenburg, Moroni ( NPD ) | 13 | 0,94% |
| 10 | Schneider, Jürgen ( BP ) | 3 | 0,22% |
| 12 | Dressendörfer, Horst ( DIE FRANKEN ) | 47 | 3,42% |
| 13 | Gudat, Max ( PIRATEN ) | 15 | 1,09% |
Zweitstimmen nach Wahlvorschlag
| Partei | Zweitstimmen | Prozent | |
|---|---|---|---|
| 1 | CSU | 849 | 62,56% |
| 2 | SPD | 135 | 9,95% |
| 3 | FREIE WÄHLER | 168 | 12,38% |
| 4 | GRÜNE | 50 | 3,68% |
| 5 | FDP | 15 | 1,11% |
| 6 | DIE LINKE | 12 | 0,88% |
| 7 | ÖDP | 12 | 0,88% |
| 8 | REP | 20 | 1,47% |
| 9 | NPD | 17 | 1,25% |
| 10 | BP | 18 | 1,33% |
| 11 | FRAUENLISTE | 8 | 0,59% |
| 12 | DIE FRANKEN | 37 | 2,73% |
| 13 | PIRATEN | 16 | 1,18% |
- Stand: 22.09.2013 16:54:17