OK.Wahl
Internetpräsentation
Version 2.2.7
Ergebnis zur Bezirkswahl 2013 am 15.09.2013
Stimmkreis Bayreuth - Kreisfreie Stadt Bayreuth
Es wurden alle Stimmbezirke ausgewertet.
 Diagramm
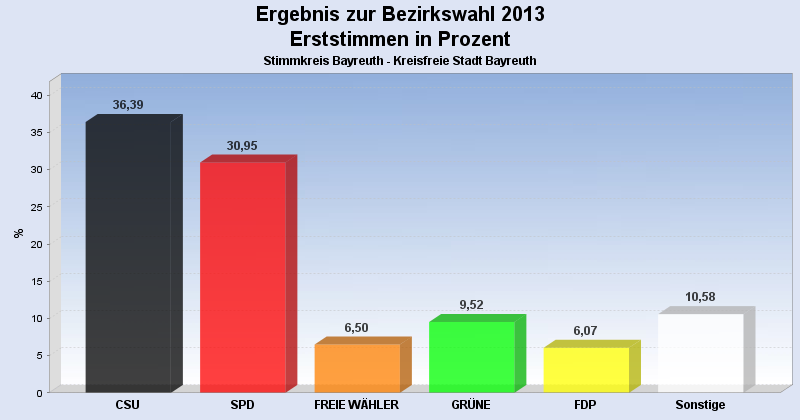
 Seitenanfang
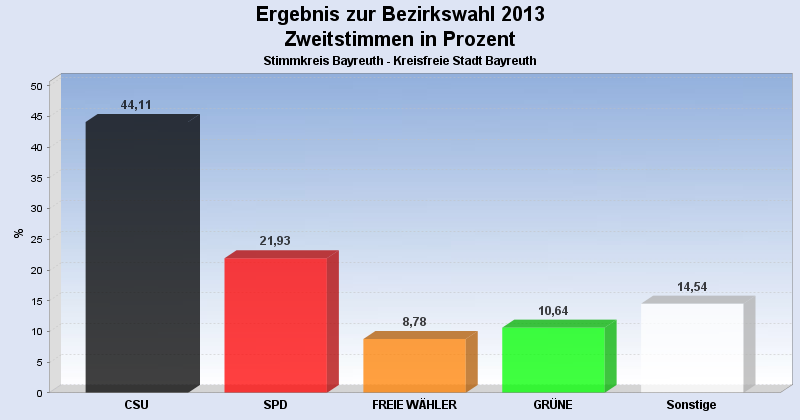
Wahlbeteiligung, Stimmzettel, Stimmen
| Wahlbeteiligung: | 57,09% |
|---|---|
| Stimmberechtigte: | 56.375 |
| Wähler: | 32.185 |
| Ungültige Erststimmen: | 477 |
| Gültige Erststimmen: | 31.703 |
| Ungültige Zweitstimmen: | 957 |
| Gültige Zweitstimmen: | 31.226 |
Erststimmen nach Wahlvorschlag
| Partei | Erststimmen | Prozent | |
|---|---|---|---|
| 1 | Dr. Specht, Stefan ( CSU ) | 11.537 | 36,39% |
| 2 | Dr. Kuhn, Beate ( SPD ) | 9.812 | 30,95% |
| 3 | Frühbeißer, Stefan ( FREIE WÄHLER ) | 2.060 | 6,50% |
| 4 | Pargent, Tim ( GRÜNE ) | 3.018 | 9,52% |
| 5 | Dr. Schweingel, Dieter ( FDP ) | 1.923 | 6,07% |
| 6 | Böhner, Georg ( DIE LINKE ) | 719 | 2,27% |
| 7 | Zimmermann, Konrad ( ÖDP ) | 298 | 0,94% |
| 8 | Prechtl, Hermann ( REP ) | 181 | 0,57% |
| 9 | Blankenburg, Moroni ( NPD ) | 212 | 0,67% |
| 10 | Schneider, Jürgen ( BP ) | 149 | 0,47% |
| 12 | Dressendörfer, Horst ( DIE FRANKEN ) | 1.058 | 3,34% |
| 13 | Gudat, Max ( PIRATEN ) | 736 | 2,32% |
Zweitstimmen nach Wahlvorschlag
| Partei | Zweitstimmen | Prozent | |
|---|---|---|---|
| 1 | CSU | 13.774 | 44,11% |
| 2 | SPD | 6.849 | 21,93% |
| 3 | FREIE WÄHLER | 2.742 | 8,78% |
| 4 | GRÜNE | 3.322 | 10,64% |
| 5 | FDP | 1.320 | 4,23% |
| 6 | DIE LINKE | 735 | 2,35% |
| 7 | ÖDP | 294 | 0,94% |
| 8 | REP | 255 | 0,82% |
| 9 | NPD | 226 | 0,72% |
| 10 | BP | 150 | 0,48% |
| 11 | FRAUENLISTE | 145 | 0,46% |
| 12 | DIE FRANKEN | 683 | 2,19% |
| 13 | PIRATEN | 731 | 2,34% |
- Stand: 22.09.2013 16:53:41