OK.Wahl
Internetpräsentation
Version 2.2.12
Ergebnis zur Landtagswahl 2018 am 14.10.2018
Stimmkreis Bayreuth - Landkreis Landkreis Bayreuth - Gemeinde Eckersdorf
Es wurden alle Stimmbezirke ausgewertet.
 Diagramm
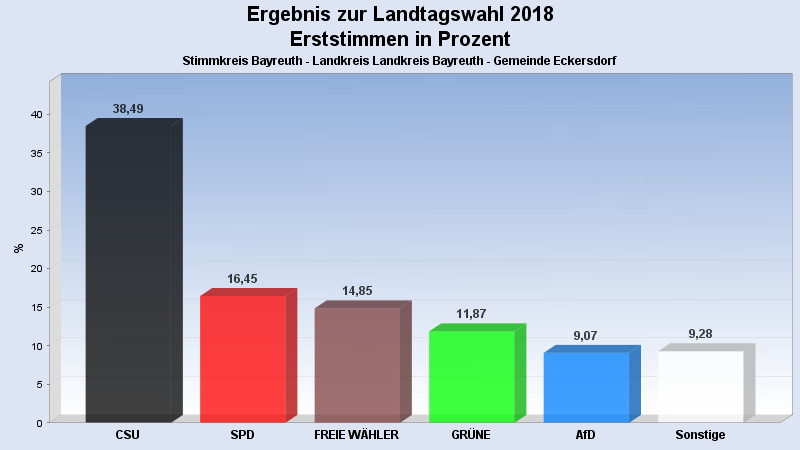
 Seitenanfang
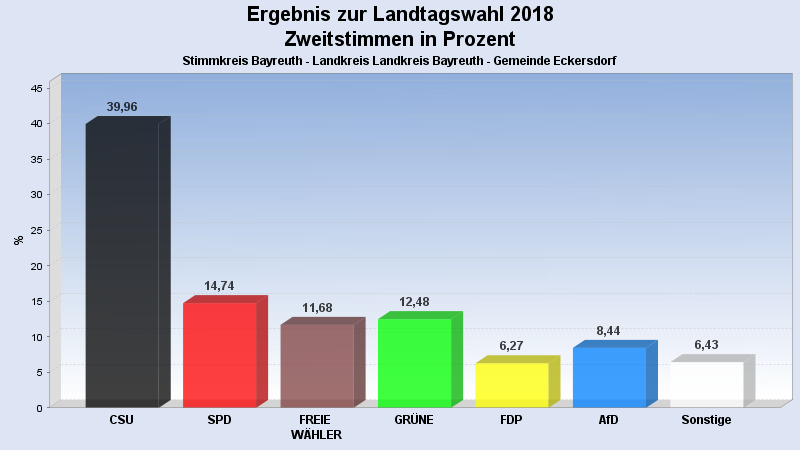
Wahlbeteiligung, Stimmzettel, Stimmen
| Wahlbeteiligung: | 78,49% |
|---|---|
| Stimmberechtigte: | 4.171 |
| Wähler: | 3.274 |
| Ungültige Erststimmen: | 21 |
| Gültige Erststimmen: | 3.253 |
| Ungültige Zweitstimmen: | 38 |
| Gültige Zweitstimmen: | 3.236 |
Erststimmen nach Wahlvorschlag
| Partei | Erststimmen | Prozent | |
|---|---|---|---|
| 1 | Brendel-Fischer, Gudrun (CSU) | 1.252 | 38,49% |
| 2 | Tasdelen, Halil (SPD) | 535 | 16,45% |
| 3 | Wiedemann, Florian (FREIE WÄHLER) | 483 | 14,85% |
| 4 | Pargent, Tim (GRÜNE) | 386 | 11,87% |
| 5 | Funke-Barjak, Luisa (FDP) | 110 | 3,38% |
| 6 | Sommerer, Sebastian (DIE LINKE) | 73 | 2,24% |
| 7 | Ehret, Alfred (BP) | 25 | 0,77% |
| 8 | Koppe, Bernd (ÖDP) | 31 | 0,95% |
| 10 | Rausch, Thomas (AfD) | 295 | 9,07% |
| 11 | Raithel, Christine (mut) | 26 | 0,80% |
| 12 | Kreten, Julian (Die PARTEI) | 18 | 0,55% |
| 14 | Frederking, Reinhard (V-Partei³) | 19 | 0,58% |
Zweitstimmen nach Wahlvorschlag
| Partei | Zweitstimmen | Prozent | |
|---|---|---|---|
| 1 | CSU | 1.293 | 39,96% |
| 2 | SPD | 477 | 14,74% |
| 3 | FREIE WÄHLER | 378 | 11,68% |
| 4 | GRÜNE | 404 | 12,48% |
| 5 | FDP | 203 | 6,27% |
| 6 | DIE LINKE | 69 | 2,13% |
| 7 | BP | 14 | 0,43% |
| 8 | ÖDP | 41 | 1,27% |
| 9 | PIRATEN | 11 | 0,34% |
| 10 | AfD | 273 | 8,44% |
| 11 | mut | 21 | 0,65% |
| 12 | Die PARTEI | 26 | 0,80% |
| 13 | Gesundheitsforschung | 6 | 0,19% |
| 14 | V-Partei³ | 20 | 0,62% |
- Stand: 22.10.2018 08:55:37